The groundbreaking discovery of Dirac cones (DCs) in graphene and topological insulators (TIs) has inspired extensive research toward Dirac physics featuring exotic physical phenomena such as Klein tunneling, zero refractive indexes, and robust topological transport. Besides, breaking the Dirac cone is usually accompanied by the topological phase transitions, opening up a new route for multidimensional robust wave manipulation.
Recent theoretical advances have suggested a novel route to achieve the hierarchy of band topology of three-dimensional (3D) topological insulators, which is intriguingly associated with a hierarchy of DCs that corresponds to various topological phase transition points across multiple dimensions. 3D honeycomb lattices with the same base configuration can exhibit 3D bulk states with an eightfold DC, two-dimensional (2D) surface states with a fourfold DC in a first-order 3D TI, one-dimensional (1D) hinge states with twofold DC in a second-order 3D TI, and zero-dimensional (0D) corner states in a third-order 3D TI, which, however, have so far evaded experimental observation.

Associate Professor Zhen Gao’s group from the Department of Electronic and Electrical Engineering at the Southern University of Science and Technology (SUSTech) has recently reported unambiguous experimental evidence of the full hierarchy of DCs and the corresponding hierarchy of band topology in 3D acoustic crystals composed of stacked 2D honeycomb lattices of interconnected acoustic resonators.
Their paper, entitled “Observation of Dirac Hierarchy in Three-Dimensional Acoustic Topological Insulators,” has recently been published and highlighted as Editors’ Suggestion in Physical Review Letters, one of the most prestigious journals in physics.
They started from a 3D acoustic crystal with an extended honeycomb cell containing multiple primitive unit cells, which feature a 3D eightfold-degenerate bulk DC with 3D bulk states. By inducing alternating dimerization along the perpendicular direction, the eightfold bulk DC can be lifted to create a first-order topological band gap where the 2D topological surface states with a fourfold DC appear.
By inducing a Kekulé distortion in the horizontal plane, the fourfold surface DC can be further lifted to create a second-order topological band gap wherein the 1D hinge states with twofold DC exist. Finally, by breaking the in-plane mirror symmetry, twofold hinge DC is lifted to create a third-order topological band gap wherein the 0D corner states emerge. All these 3D TIs are characterized by in-plane and out-of-plane winding numbers.
The full hierarchy of DCs and the topological phases have been directly visualized via the acoustic field imaging measurements and spatial Fourier transformation. To experimentally demonstrate the Dirac and topological phases hierarchy, a series of 3D acoustic crystals were fabricated using a standard 3D printing technique.
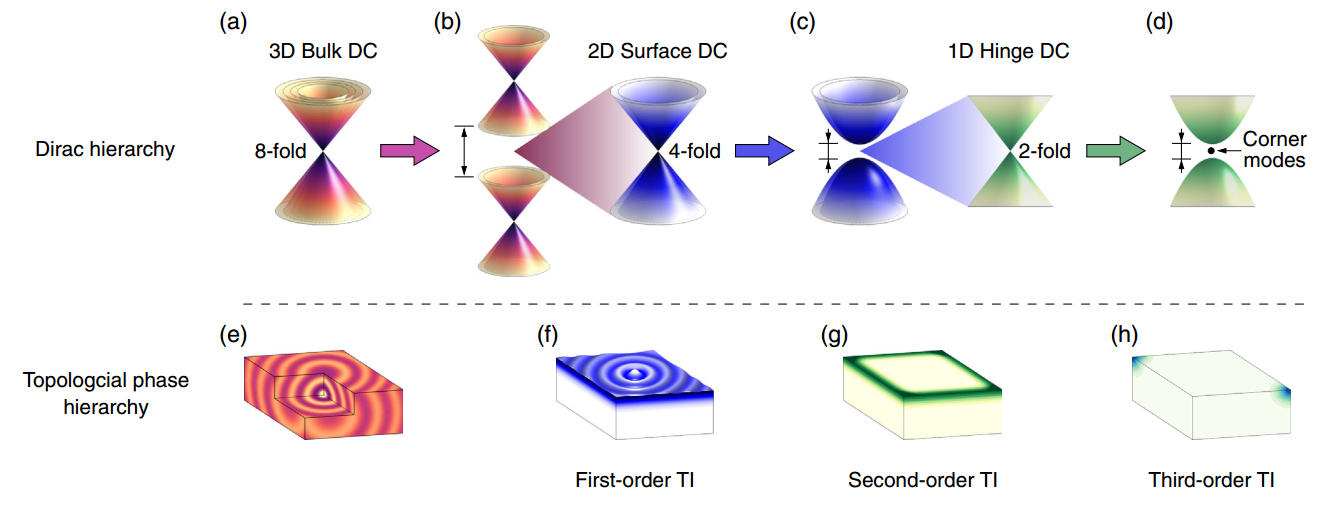
Figure 1. Dirac hierarchy and topological phase hierarchy
Fig. 1 shows a schematic diagram of the design principle of the hierarchy of DCs in 3D acoustic TIs. Starting from the eight-fold degenerate DC of the 3D acoustic crystal with 3D stacked hexagonal honeycomb lattice with gapless bulk bands [Fig. 1 (a) and (e)], by tuning the in-plane and out-of-plane couplings, the first-order TI with four-fold degenerate DC surface state [Fig. 1 (b) and (f)], the second-order TI with two-fold degenerate DC edge state [Fig. 1 (c) and (g)], and the third-order TI with localized corner state [Fig. 1 (d) and (h)] can be realized respectively.

Figure 2. Design and band diagram of the first-order 3D acoustic TI
The first experimental sample in Fig. 2(a) exhibits the first-order topological insulating phase, supporting 2D topological surface states with a fourfold DC. The details of the unit cell are shown in Fig. 2(b). According to the zone-folding mechanism, when both interlayer couplings equal to each other, and the intercell coupling is equal to the intracell coupling, an eightfold bulk DC (red sphere) emerges at Z (kz = π) in the band structure with the frequency around 4.6 kHz for the lowest twelves bands, as shown in Fig. 2(c). By inducing an inequality in the interlayer couplings, the dimerization along the z direction lifts the eightfold DC degeneracy, leading to an extremely wide 3D topological bandgap from 3.8 kHz to 5.0 kHz (grey region), as shown in Fig. 2(d).
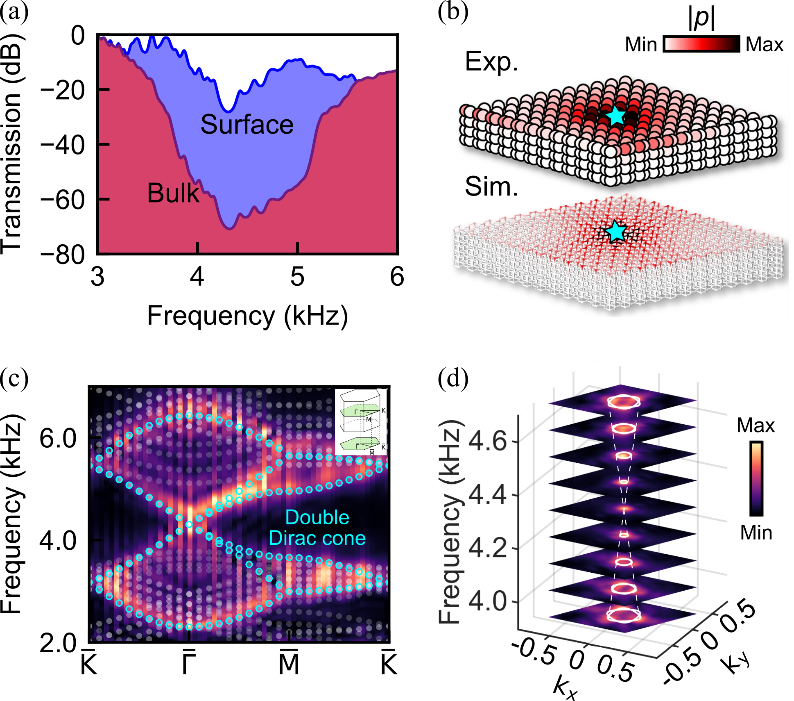
Figure 3. Experimental observation of the fourfold surface DC in the first-order 3D acoustic TI
The measured transmission along the surface (blue region) and in bulk (red region) are shown in Fig. 3(a). A wide transmission dip from approximately 3.8 kHz to 5.0 kHz in the transmission of the bulk states was observed. High transmission spanning the whole bandgap was observed on the surface, indicating the existence of gapless topological surface states. The pump-probe measured and simulated field distributions on the sample’s external surface at 4.4 kHz are shown in Fig. 3(b), exhibiting good confinement of waves on the top surface.
The measured surface dispersion along the high-symmetry line of the (001)-projected first Brillouin zone is displayed in Fig. 3(c), revealing a family of topological surface states spanning the frequency range of the bulk bandgap with a gapless fourfold DC around 4.3 kHz. The measured isofrequency contours in 2D reciprocal space from 3.9 kHz to 4.7 kHz, as shown in Fig. 3(d), confirming the conical nature of the surface dispersion.
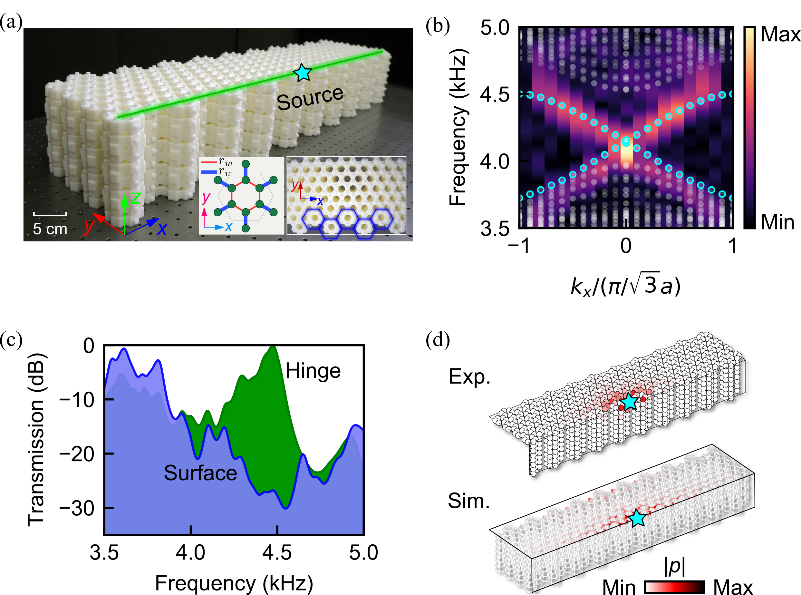
Figure 4. Experimental observation of the twofold hinge DC in the second-order 3D acoustic TI
The second acoustic crystal sample with unequal intracell and intercell couplings is shown in Fig 4(a), which has a molecule-zigzag type hinge parallel to the x-axis (see the inset). Fig 4(b) shows the measured (background color) and simulated (cyan hollow circles) dispersion diagrams of the hinge state indeed reveal a gapless hinge Dirac point appears near the frequency of 4.2 kHz.
Fig. 4(c) shows the measured transmission spectra of the surface states (blue region) with a bandgap from 4.0 kHz to 4.6 kHz, the high transmission of the hinge state (green region) exhibiting an enhancement of about 30 dB to that of the surface states. The measured and simulated acoustic pressure distributions at 4.2 kHz are presented in Fig. 4(d) to verify that the hinge states are tightly confined and propagate on the hinge of the second-order acoustic TIs.
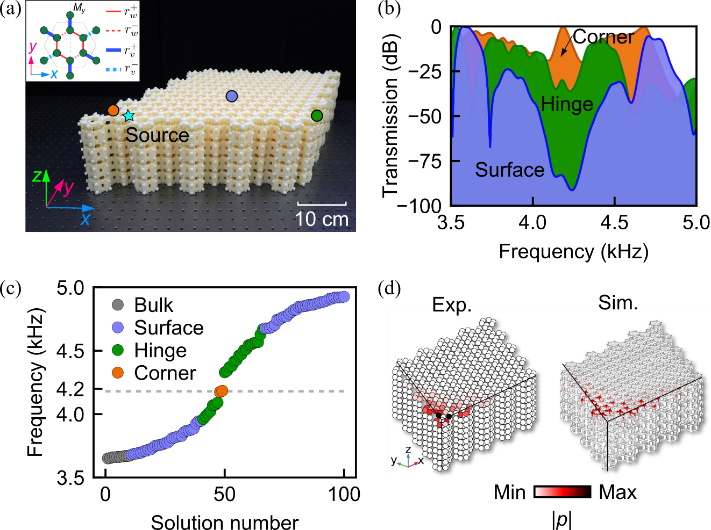
Figure 5. Experimental observation of 0D corner states in the third-order 3D acoustic TI
The third acoustic crystal sample has rhomb-shaped surface terminations with molecule-zigzag boundaries, as shown in Fig. 5(a). The measure of the transmission spectra of the surface (blue region), hinge (green region), and corner (yellow region) states under the excitation of a point source placed near a sample’s corner are shown in Fig. 5(b), in which the corner measurement exhibits a transmission peak within the surface and hinge bandgap, which agrees well with the respective eigenfrequency ranges of the numerically calculated corner, hinge and surface eigenstates [Fig. 5(c)]. Lastly, in Fig. 5(d), it presents the measured and simulated acoustic pressure distributions at 4.18 kHz, revealing the localized characteristic of the topological corner state.
Linyun Yang, a postdoctoral fellow from the Department of Electronic and Electrical Engineering at SUSTech, and Yin Wang, a Ph.D. student from Jiangsu University, are the co-first authors of this paper. Assoc. Prof. Zhen Gao from SUSTech, Prof. Yihao Yang from Zhejiang University, Prof. Hongxiang Sun from Jiangsu University, and Dr. Guigeng Liu from Nanyang Technological University are the co-corresponding authors. SUSTech is the first affiliation.
This research was supported by the National Natural Science Foundation of China (NSFC), Fundamental Research Funds for the Central Universities, Excellent Young Scientists Fund Program (Overseas) of China, National Key Research and Development Program of China, and SUSTech.
Paper link: https://journals.aps.org/prl/abstract/10.1103/PhysRevLett.129.125502
To read all stories about SUSTech science, subscribe to the monthly SUSTech Newsletter.
Proofread ByAdrian Cremin, Yingying XIA
Photo By