A reservoir is an artificial lake where water is collected and stored for various purposes, such as flood control, irrigation, hydropower generation, industrial use, etc. In a changing climate, drought events can cause a decline in the natural flow of streams and rivers to the reservoirs. Consequently, many of the functions provided by the reservoir might be halted if the drought continues, just like in the cases of Lake Powell and Lake Mead.
The past decade saw several record‐breaking global annual temperatures, which caused extreme droughts; thus, the reservoir filling up and successful operation (reservoir sustainability) are challenged. How have global reservoirs been affected in terms of the filling up? So far, there is no publicly available in-situ data to answer this question.
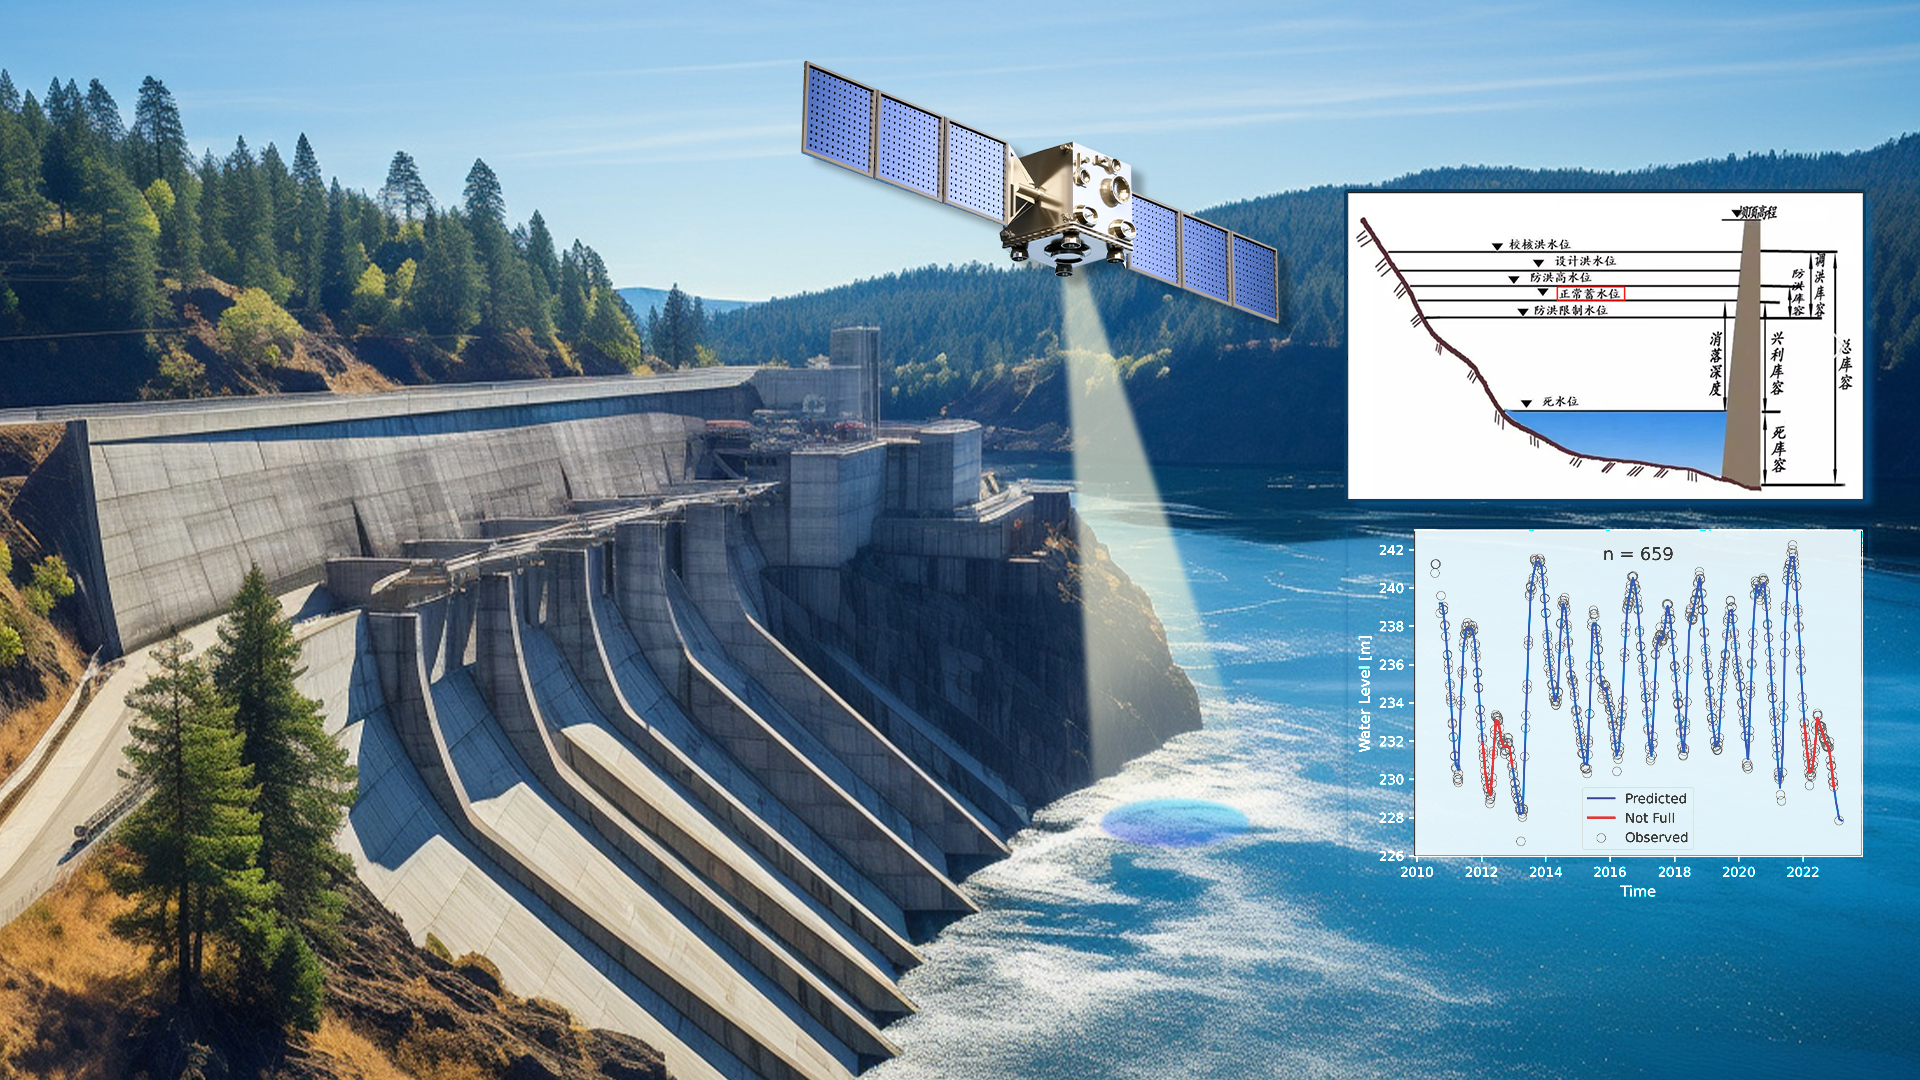
Assistant Professor Liguang Jiang’s research team from the School of Environmental Science and Engineering (ESE) at the Southern University of Science and Technology (SUSTech) has recently published a paper that uses CryoSat-2 measurements to track the reservoir water levels from 2010 till 2022.
Their research work, entitled “Reservoir Filling Up Problems in a Changing Climate: Insights From CryoSat‐2 Altimetry”, has been published in Geophysical Research Letters, a top journal in the field of geophysical research.
Leveraging more than a decade of CryoSat‐2 altimetry observations, they provided a global picture of this issue. The results show that reservoirs with a downward trend are mainly distributed in the Southern Hemisphere (Figure 1a). Furthermore, the fluctuation of reservoir level (Figure 1b) also presents regional characteristics in latitude with an average value of 3.96 m on the global scale.
This pattern is strongly related to the status of socio‐economic development regardless of the main purposes of reservoirs. It is worthwhile to mention that 80.5% of reservoirs with fluctuation of less than 3 m are located in developed economies or economies in transition, and reservoir levels in regions with better socio‐economic development fluctuate less. This may imply that prudent rules of reservoir regulation have been taken in regions with better social economies.
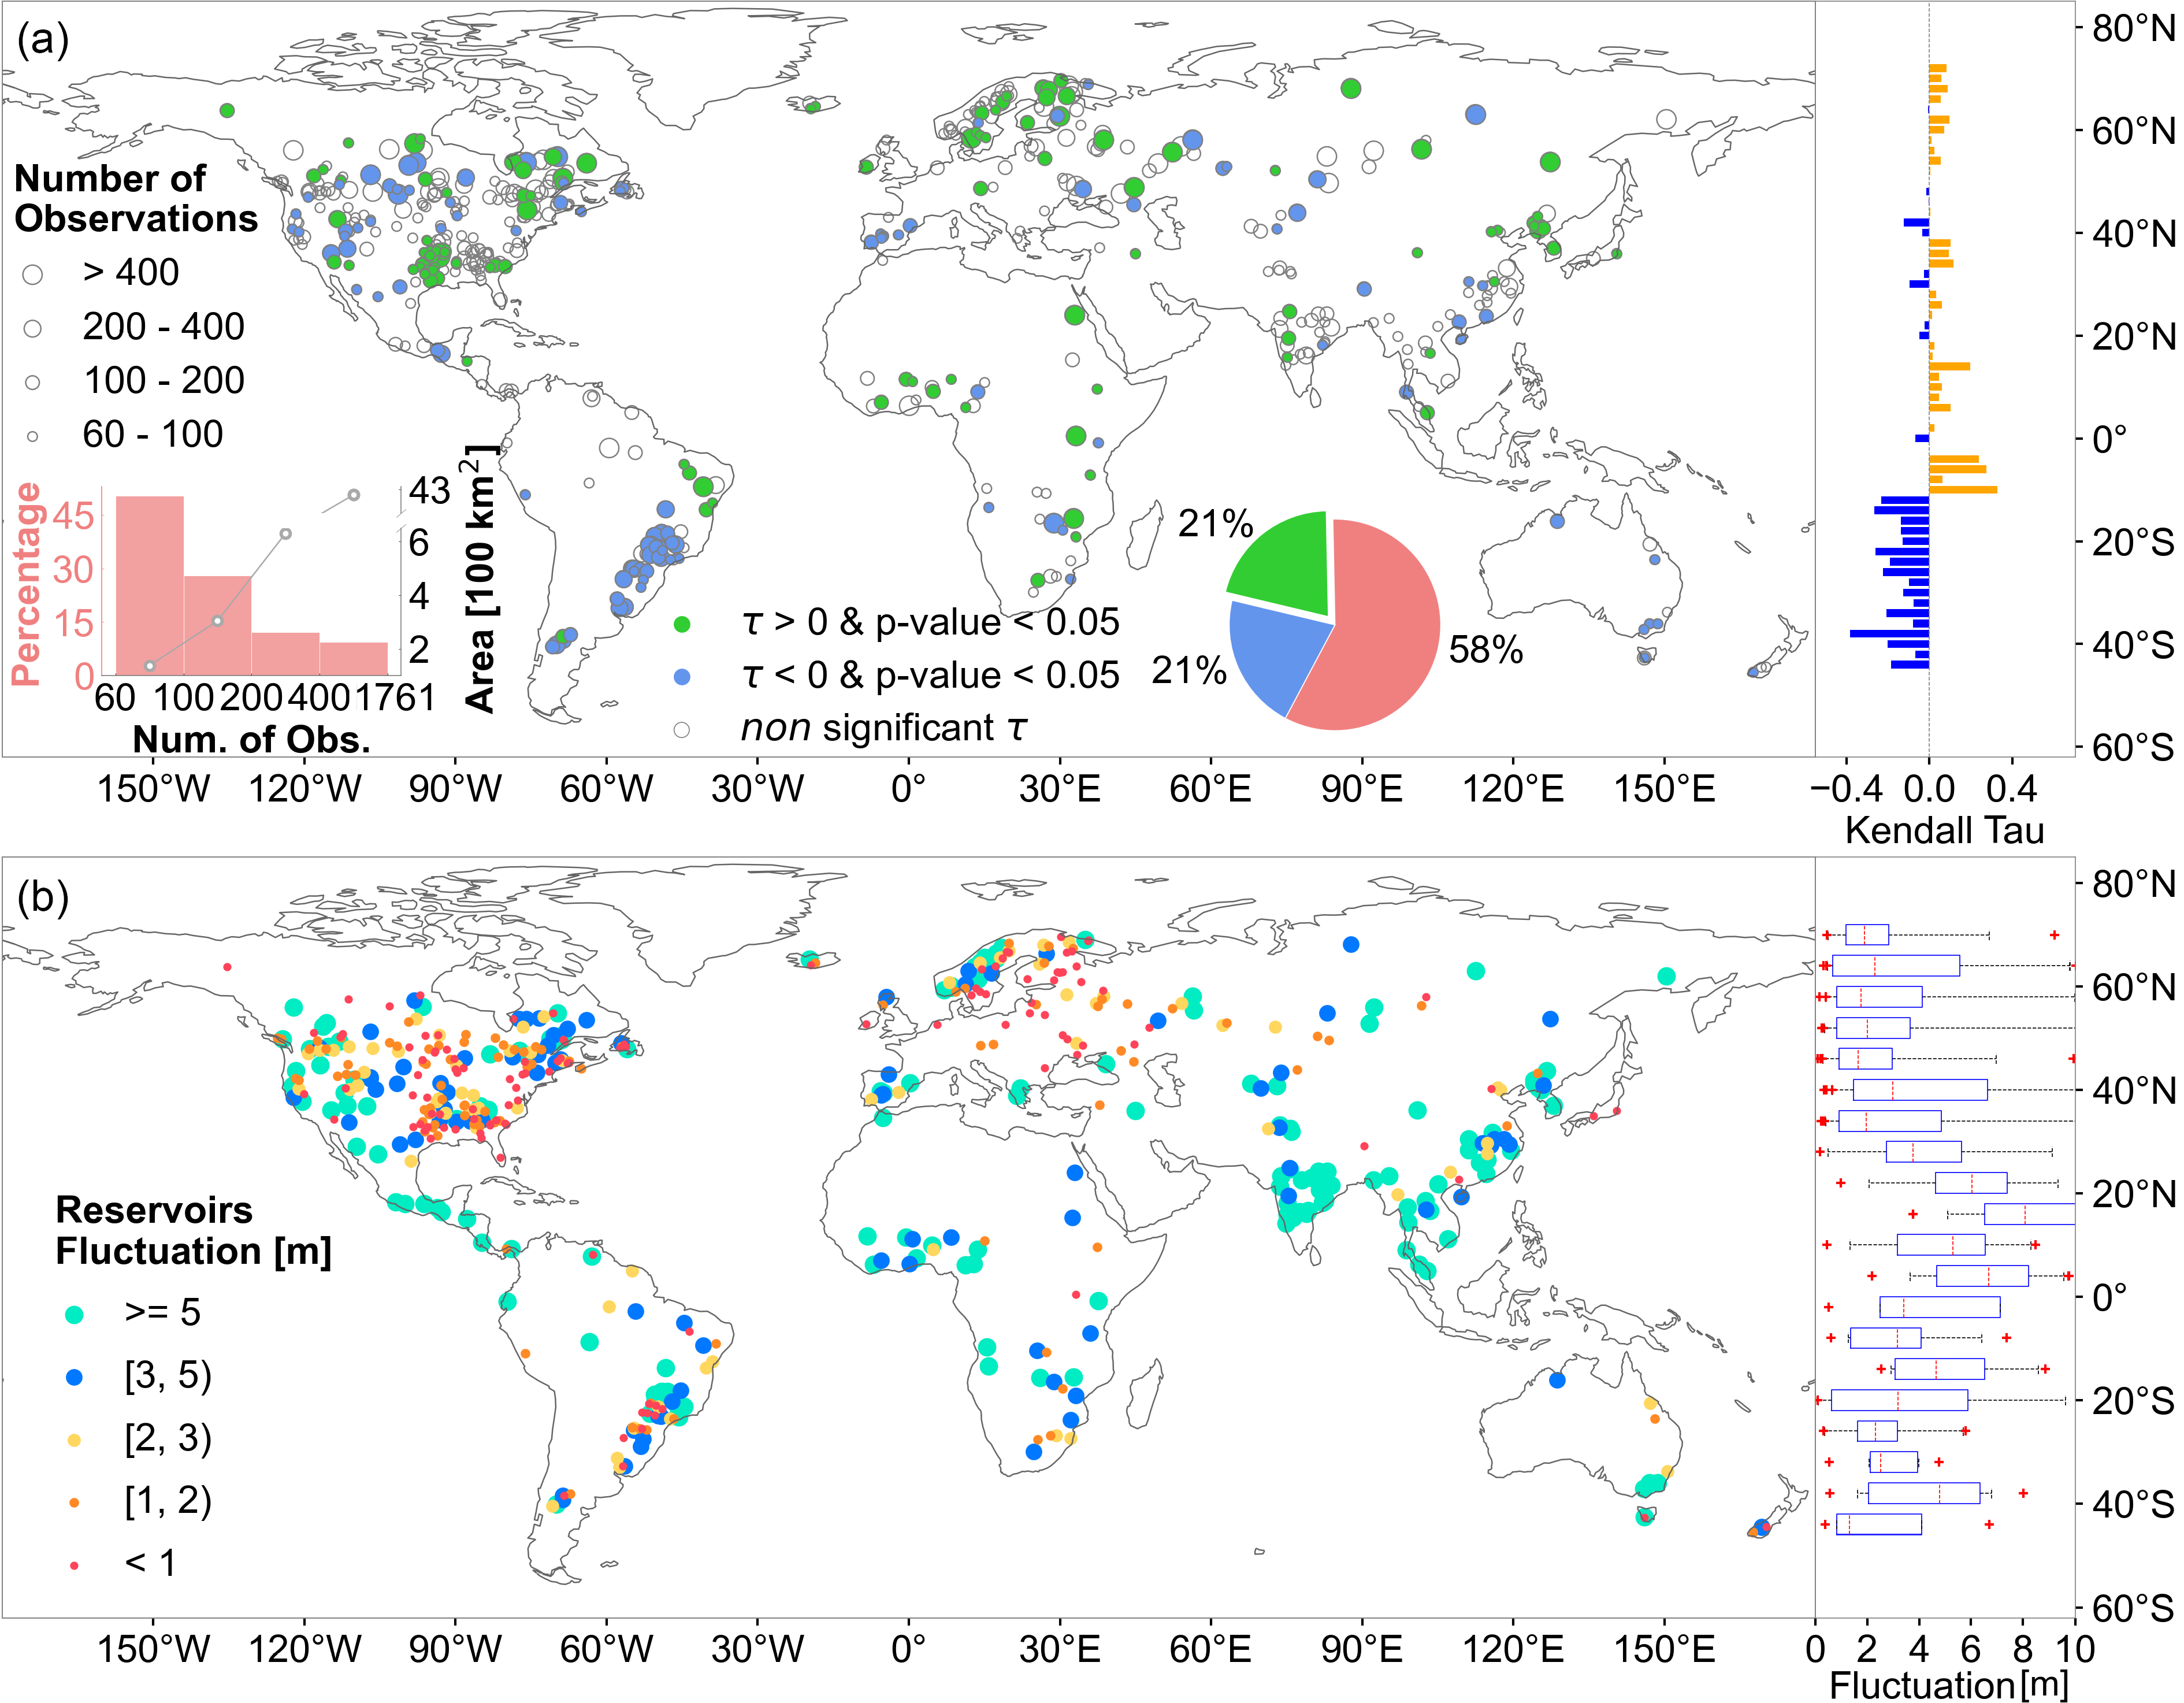
Figure 1. Spatial distribution of trends of reservoir water level and fluctuation
They also found that 93% of studied reservoirs have not been fully filled up at least once during 2010-2022 (Figure 2). Figure 2b shows the proportion and the corresponding average NFI scores based on the reservoir capacity. It seems highly probable that reservoirs with larger capacities have lower NFI. Smaller ones are more prone to be unfilled. This may indicate that smaller reservoirs have lower resilience to climate change or worse water management strategies. Moreover, the number and NFI score of non‐full reservoirs in each year vary. They are relatively lower in 2011 and 2017-2020 but higher in 2012, 2015, 2021, and 2022, concurring with ENSO events.
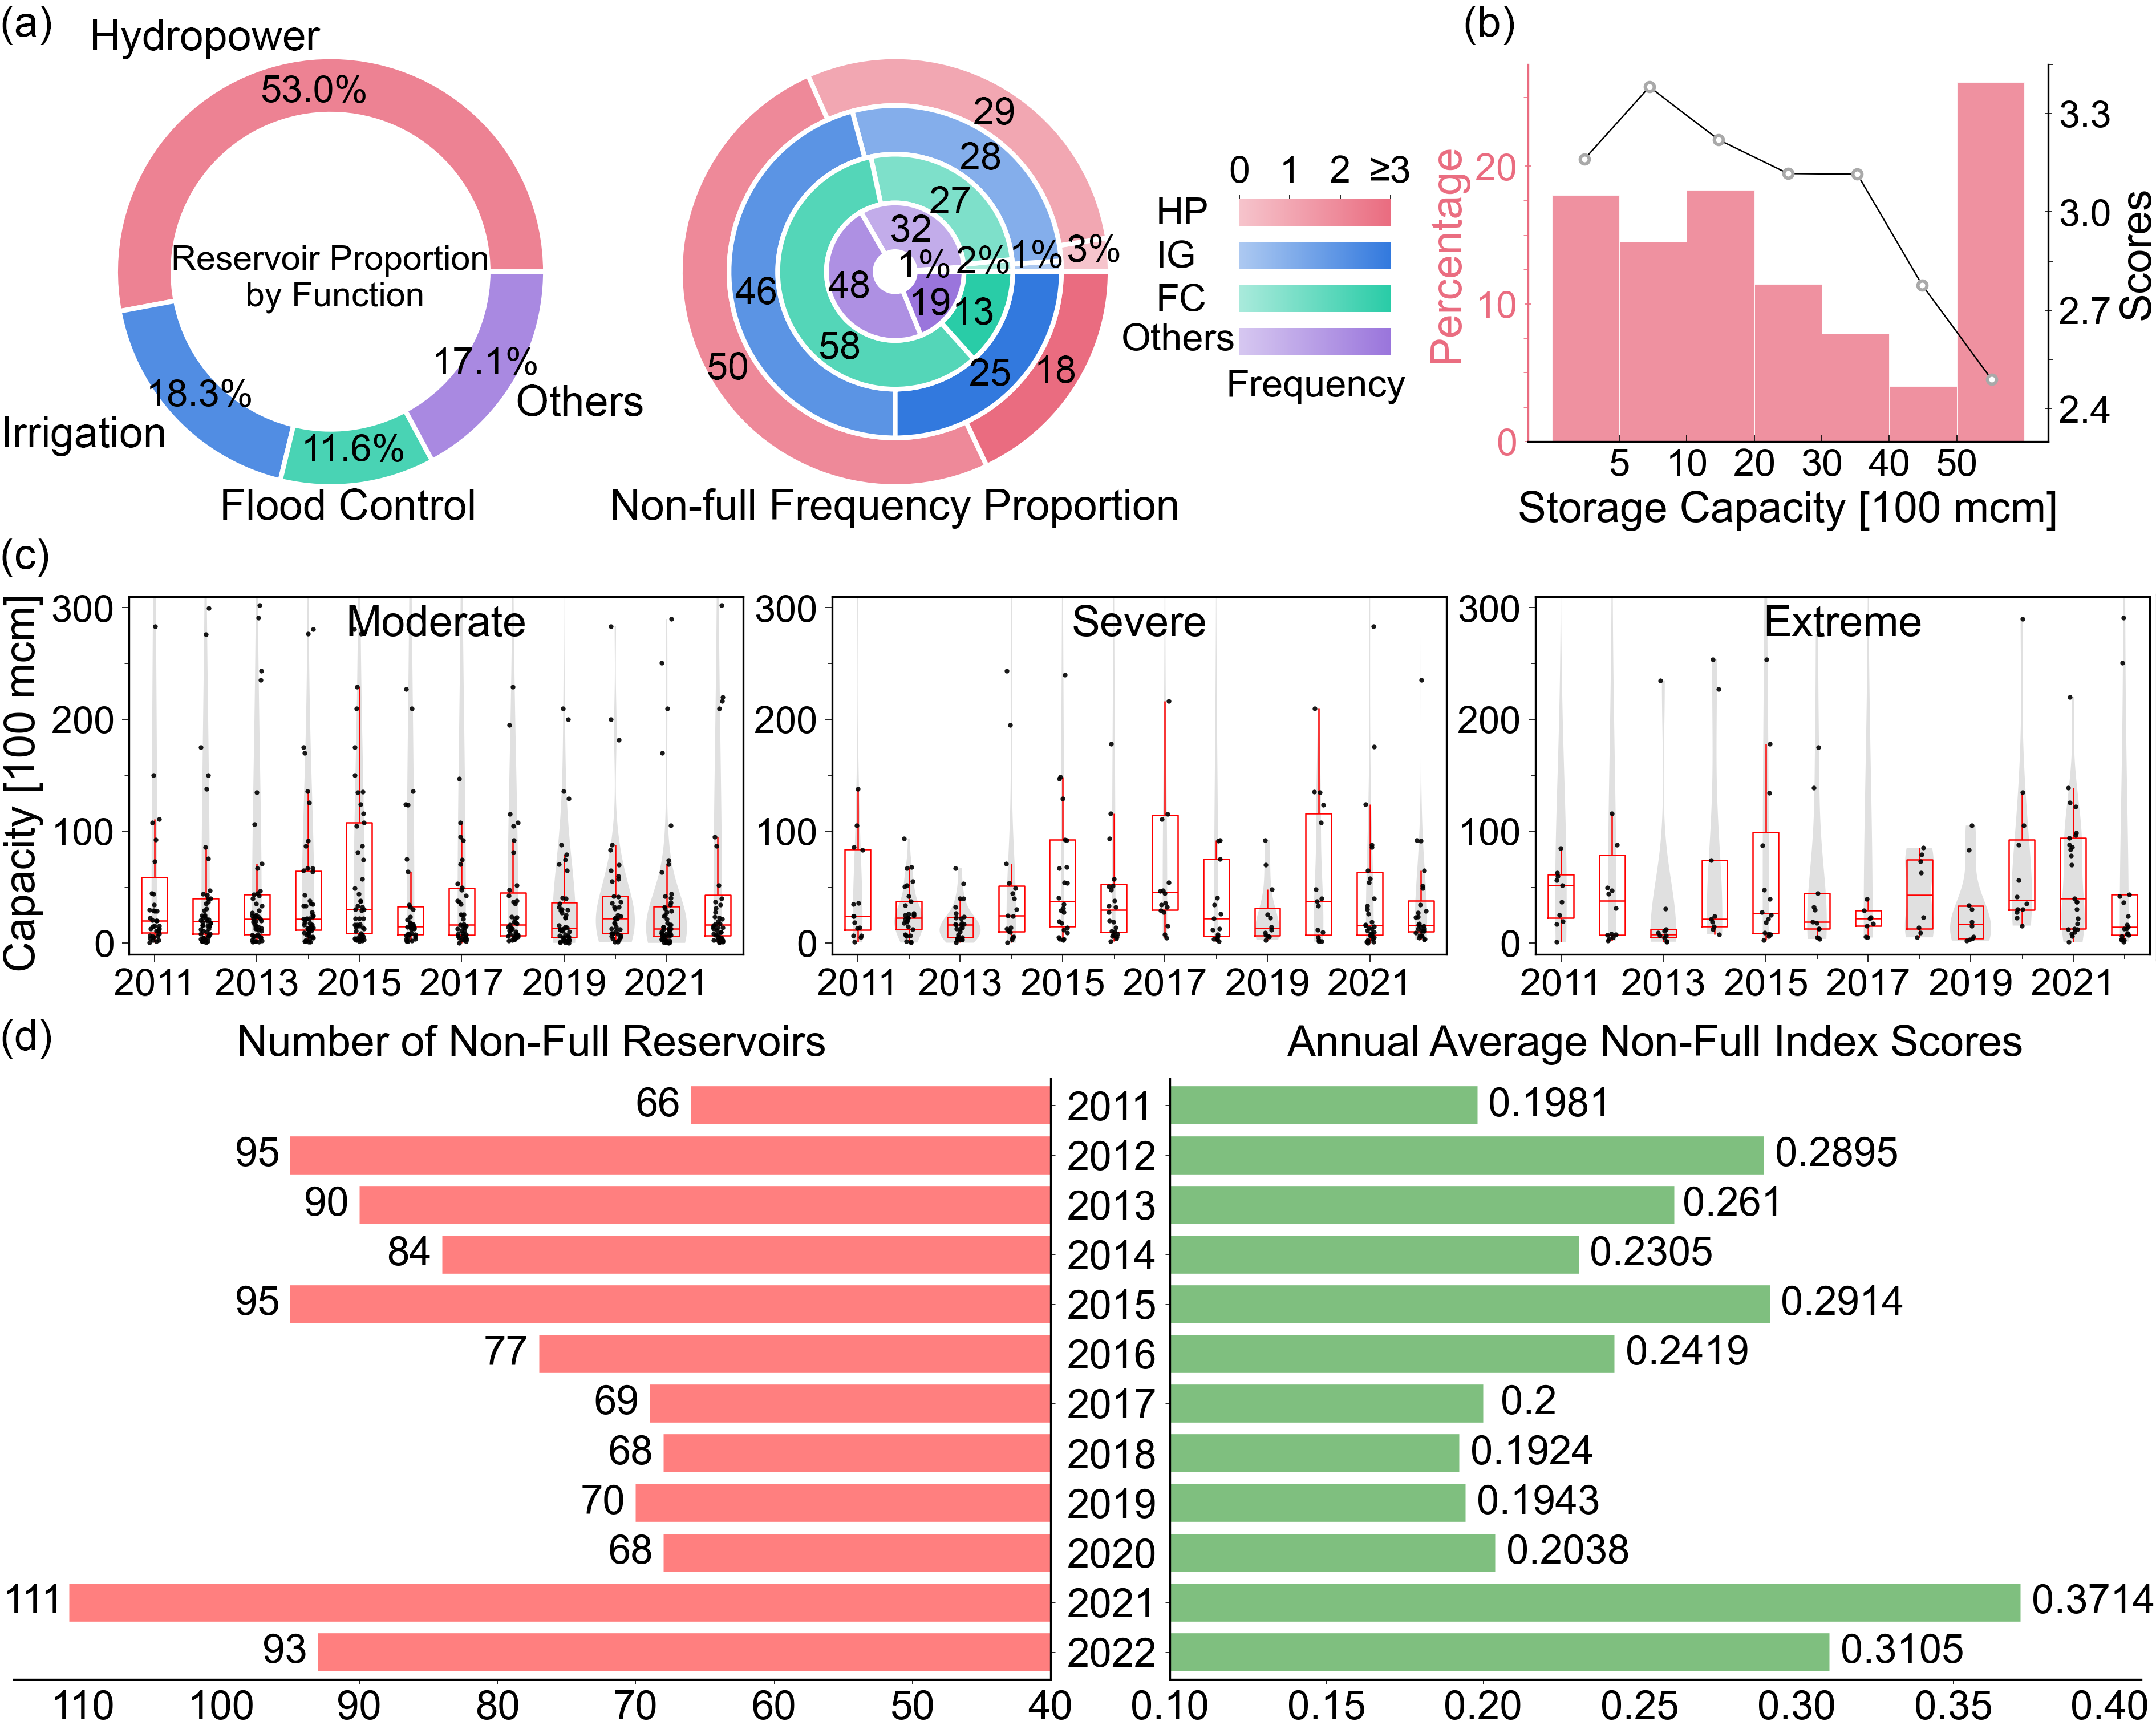
Figure 2. Statistics of reservoirs that were not filled up based on function, capacity, and year
Figure 3 shows that reservoirs in the Southern and Northern Hemispheres have very different behaviors, especially in ENSO years. Their further analyses revealed that droughts are the most probable culprits. About 86% of the 398 reservoirs with accessible SPEI data exhibited significant susceptibility to drought, while 43% of the 525 reservoirs demonstrated notable sensitivity to ENSO events.
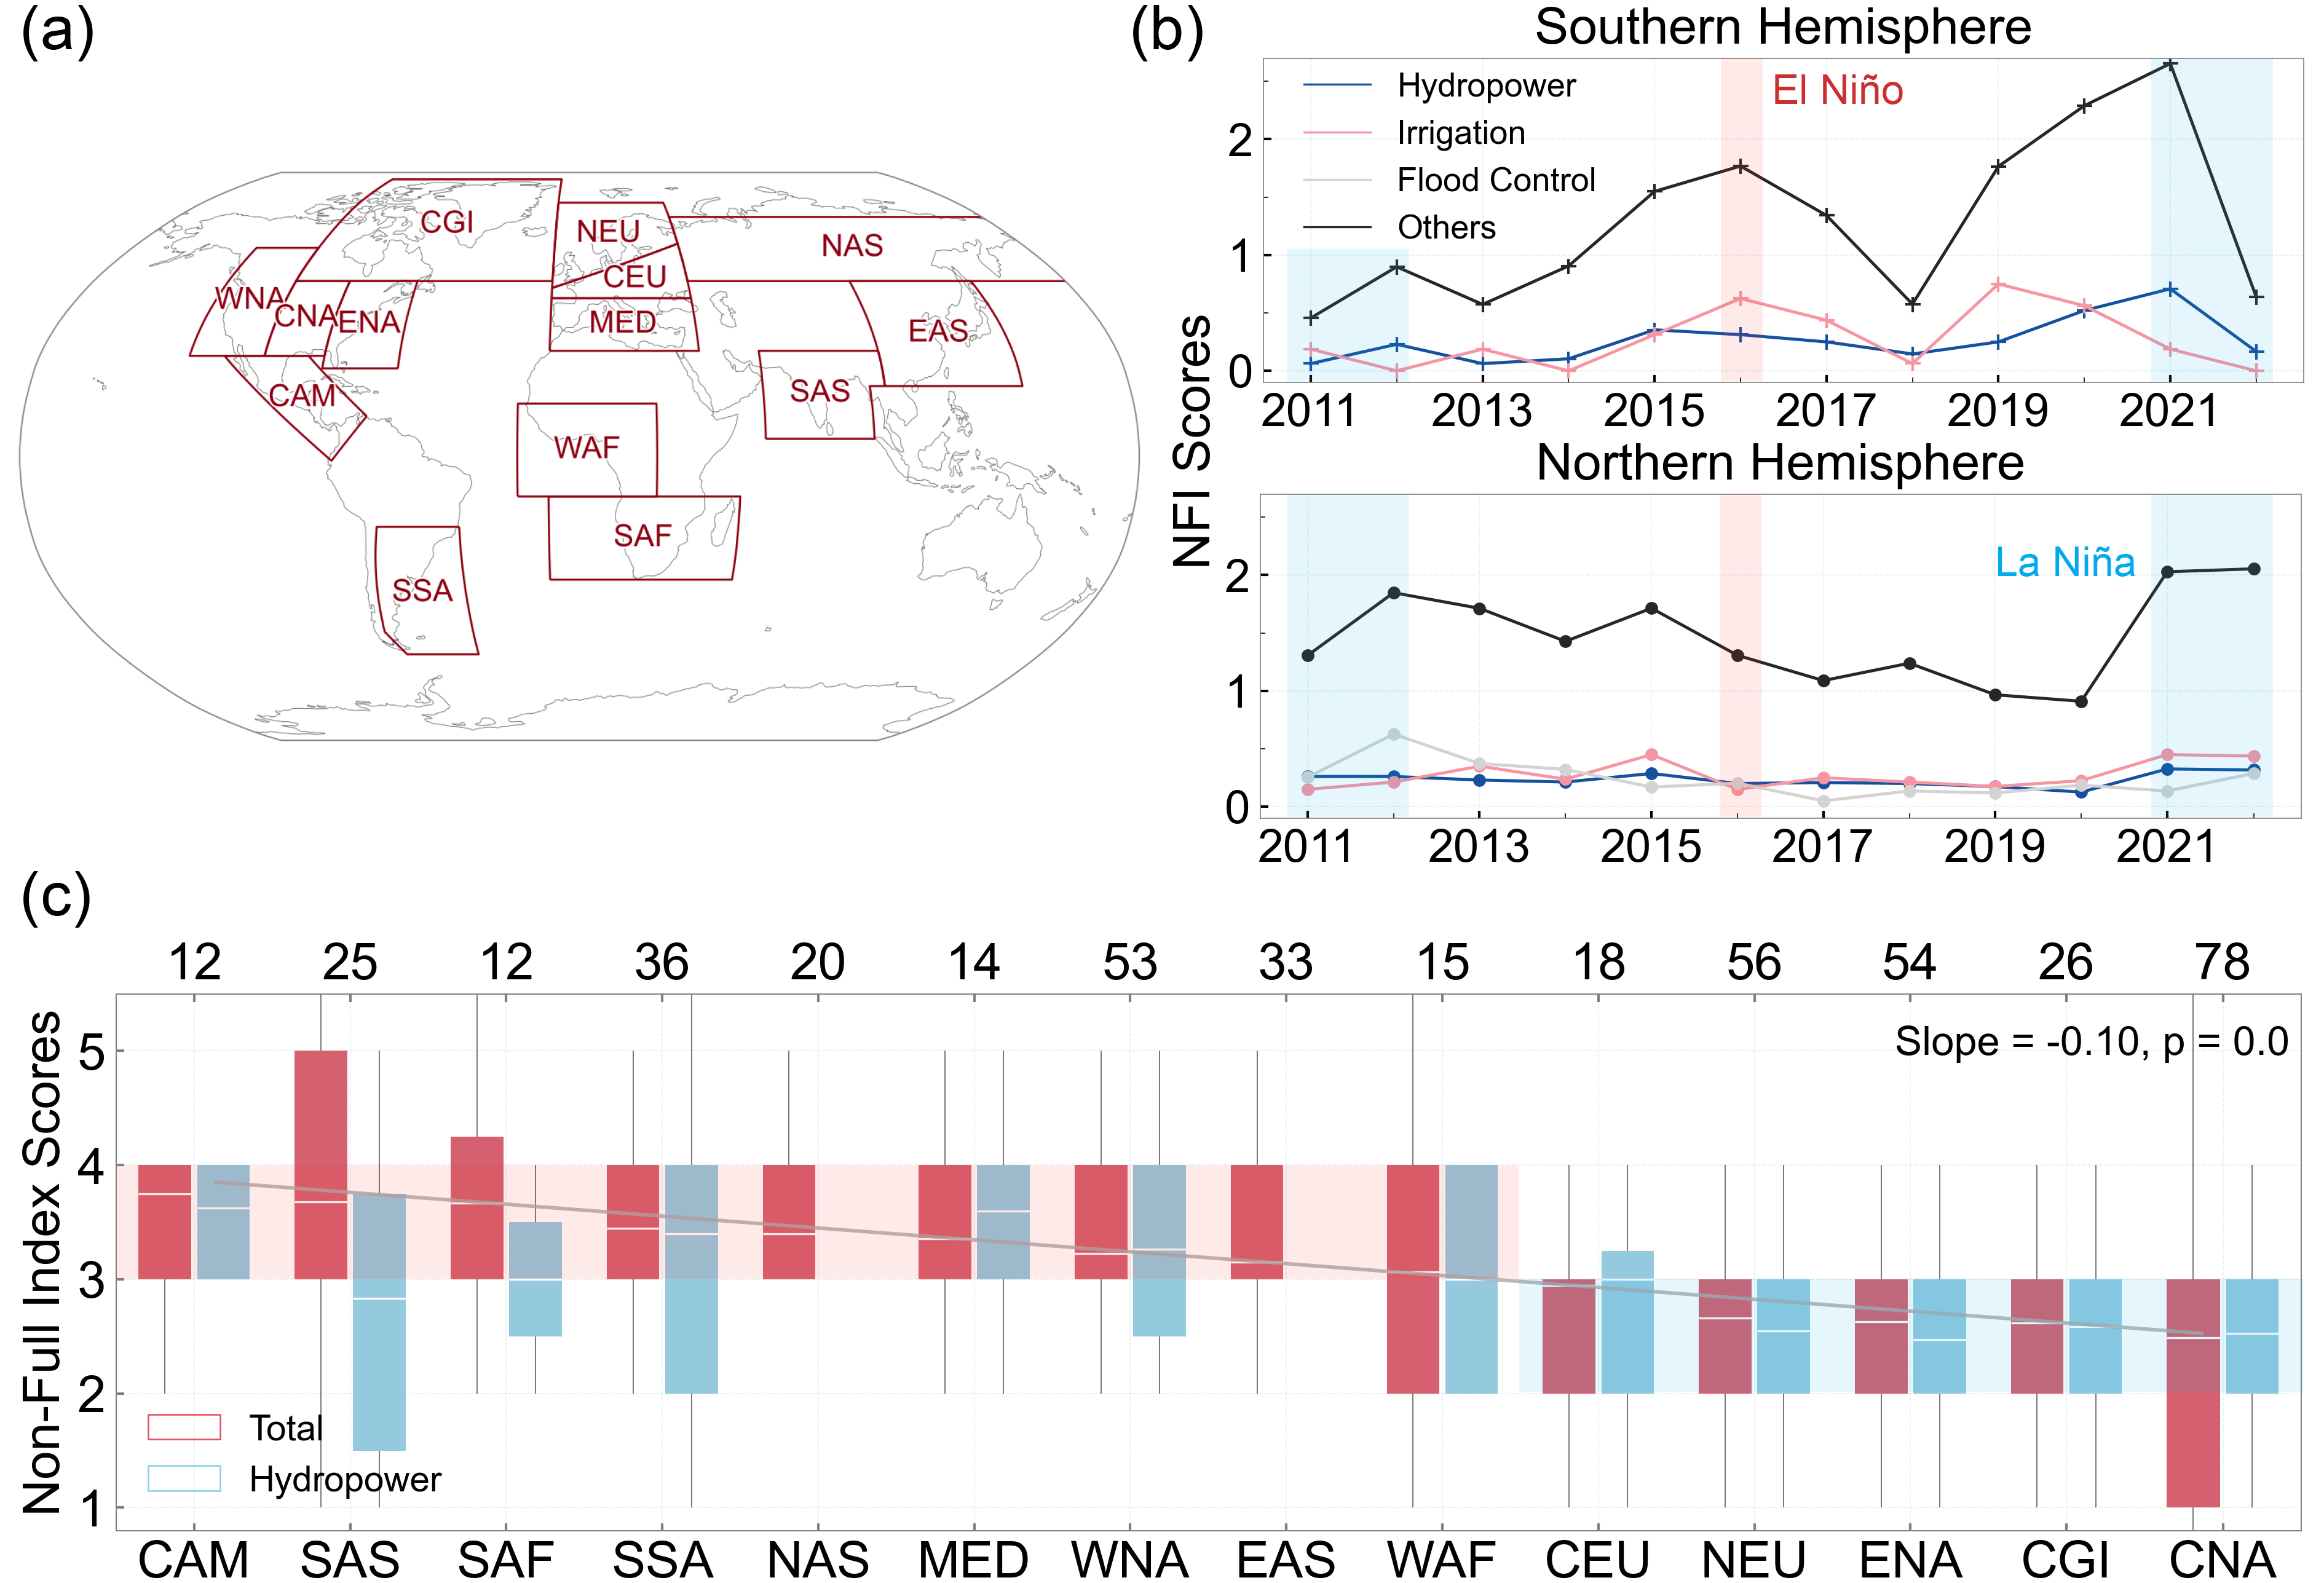
Figure 3. Assessment of Non-full index over different SREX regions
These findings have important implications for future reservoir operations to cope with more intensive drought events. It also means the benefits and costs of both existing and planned reservoirs need to be re‐assessed to take adaptation strategies.
Zhiwei Wang, a master’s student in Assistant Professor Liguang Jiang’s research group, is the first author of the paper. Assistant Professor Liguang Jiang is the corresponding author, and SUSTech is the first affiliation.
This study was supported by the Shenzhen Key Laboratory of Precision Measurement and Early Warning Technology for Urban Environmental Health Risks, the CRSRI Open Research Program, and the SUSTech Research Start‐Up Grants. The computation of this work was supported by the Center for Computational Science and Engineering at SUSTech.
Paper link: https://agupubs.onlinelibrary.wiley.com/doi/10.1029/2024GL108934
To read all stories about SUSTech science, subscribe to the monthly SUSTech Newsletter.
Proofread ByAdrian Cremin, Yingying XIA
Photo BySchool of Environmental Science and Engineering


