Tropospheric ozone is an air pollutant, a greenhouse gas, and an oxidant affecting climate and chemistry. In Southeast Asia (Figure 1), including the Peninsular Southeast Asia (PSEA) and the Maritime Continent (MC), tropospheric and surface ozone concentrations have reportedly been increasing at individual locations in recent decades.
The rising precursor emissions over Southeast Asia might have led to disproportional tropospheric ozone increases, as ozone photochemical production is faster and more NOx-sensitive in the tropics. However, the long-term ozone trends across Southeast Asia and the drivers of such trends have not been systematically assessed, impeding effective air quality management in the region.
Professor Tzung-May Fu’s research team from the School of Environmental Science and Engineering at the Southern University of Science and Technology (SUSTech) collaborated with researchers from Peking University (PKU) to assess the surface and tropospheric ozone changes and their drivers over Southeast Asia from 2005 to 2016.
Their research, entitled “Rapidly Changing Emissions Drove Substantial Surface and Tropospheric Ozone Increases Over Southeast Asia,” was published in Geophysical Research Letters, a top journal in the field of geosciences.
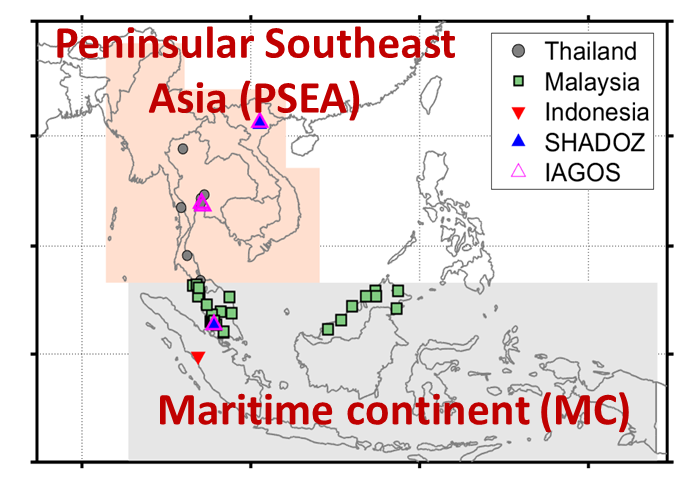
Figure 1. The study domain over Southeast Asia, consisting of the Peninsular Southeast Asia (PSEA, pink shaded) and the Maritime Continent (MC, grey shaded). Also shown are the locations of the available in situ ozone measurements.
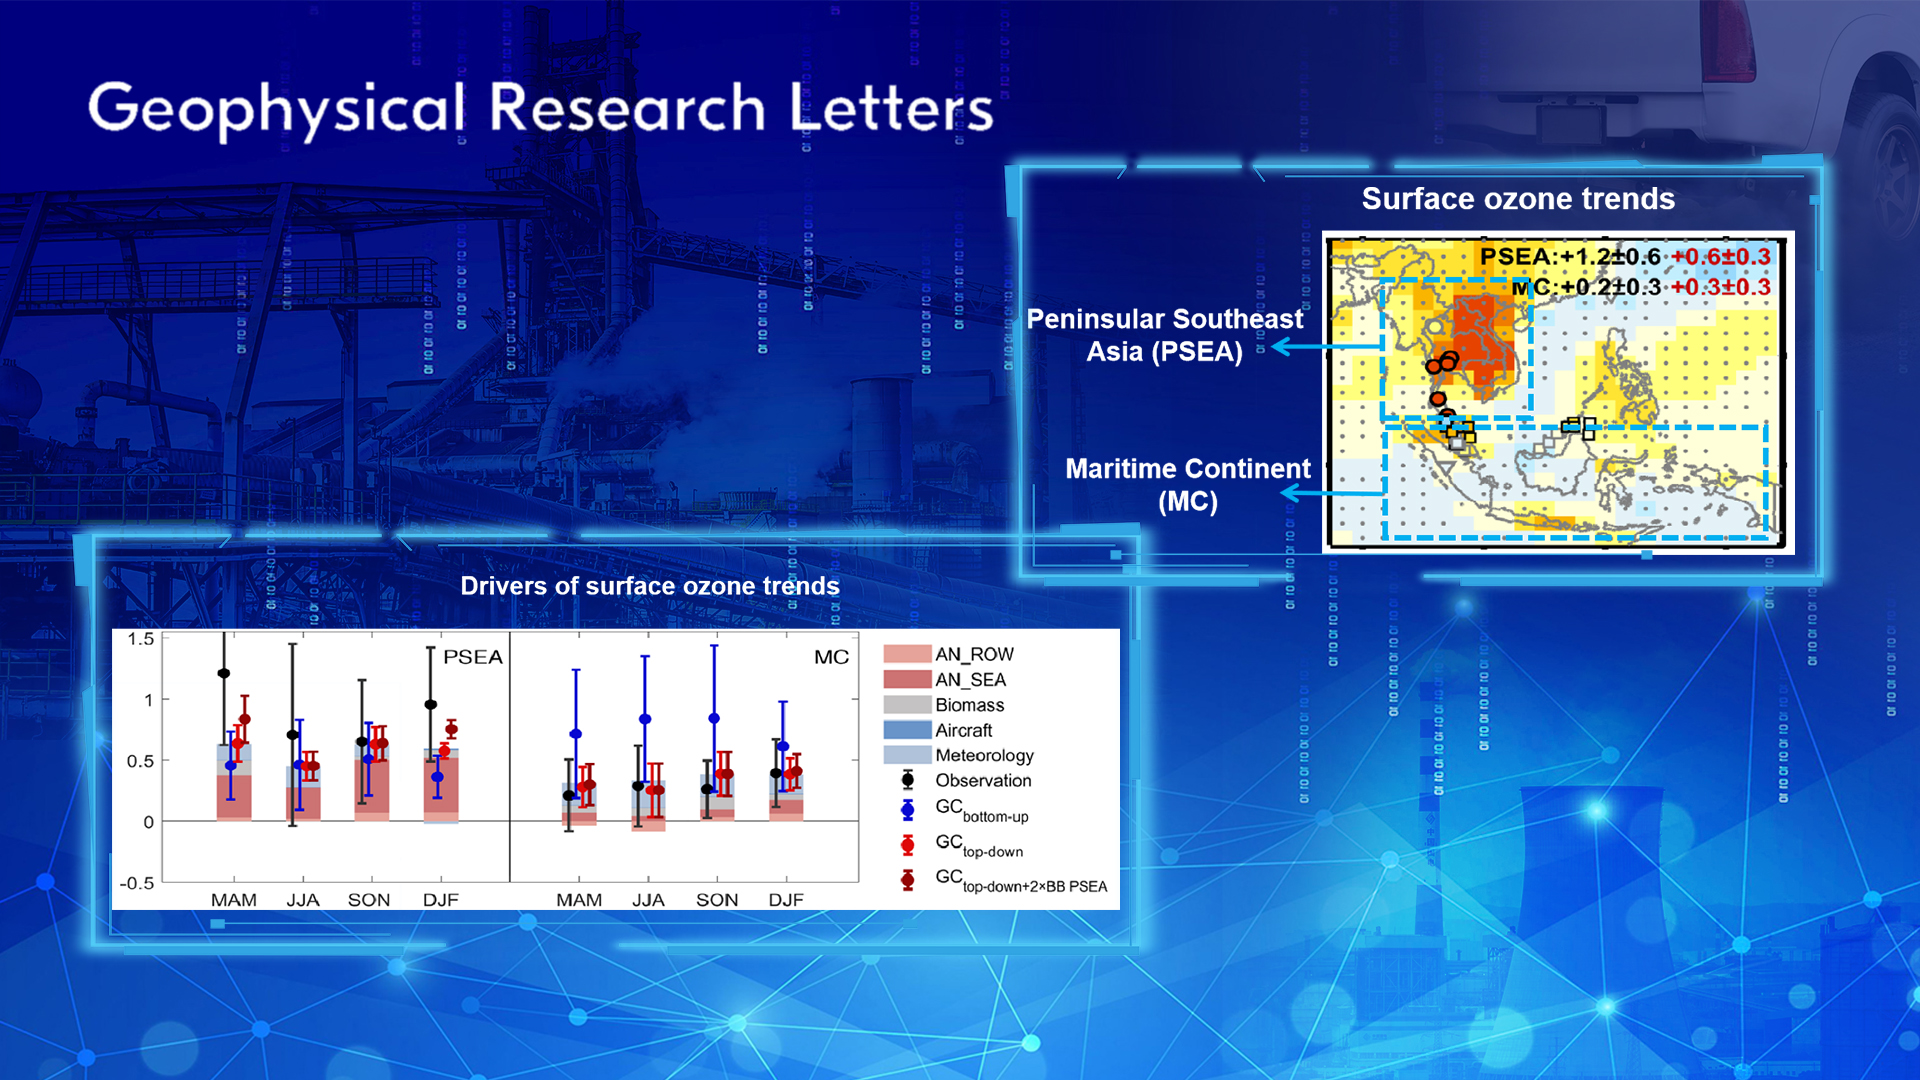
In this study, the researchers conducted an integrated analysis of ozone observations from surface sites, aircraft, ozonesondes, and satellite instruments over Southeast Asia from 2005 to 2016 to quantify the regional ozone trends. They found that observed surface ozone concentrations showed consistent increases (seasonal mean ranged from 0.7 to 1.2 ppb year−1) over Central and Western Thailand during the years 2005 to 2016 (Figure 2), especially during the dry season, and scattered increases over the Peninsular Malaysian and Borneo Malaysia (seasonal mean ranged from 0.2 to 0.4 ppb year−1). The tropospheric column ozone (TCO) also increased throughout Southeast Asia in all seasons between 2005 and 2016 (Figure 3), with the most prominent trends over the PSEA in MAM (0.35 ± 0.16 DU year−1) and over the MC in SON (0.37 ± 0.10 DU year−1).
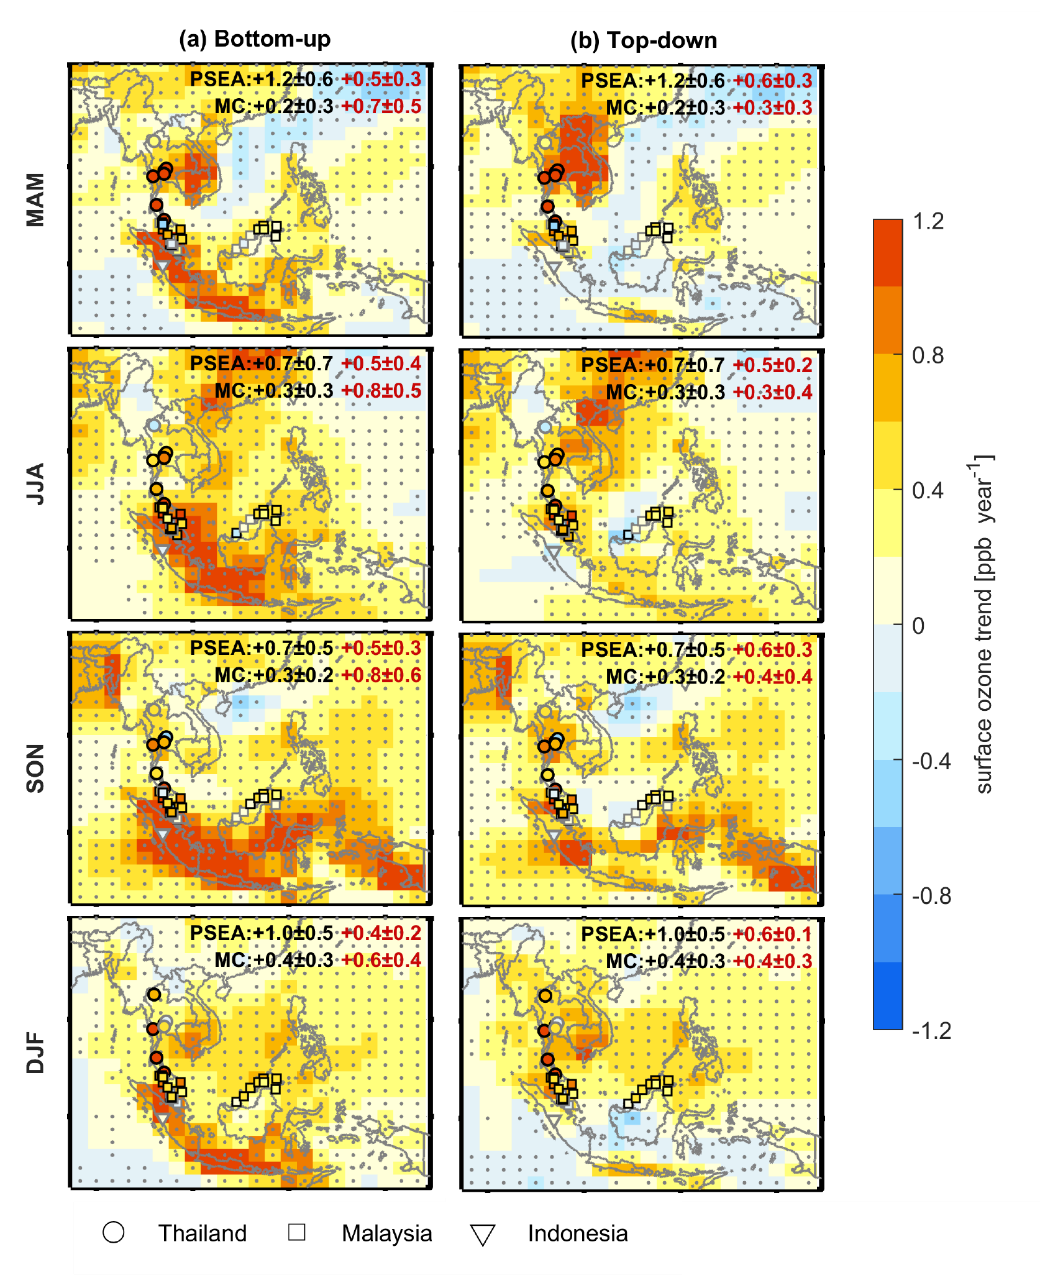
Figure 2. Comparison of observed (symbols) and simulated (filled pixels) trends of seasonal mean surface ozone concentrations over Southeast Asia for the years 2005 to 2016. (a) simulation driven by bottom-up emissions, and (b) simulation driven by top-down emissions.
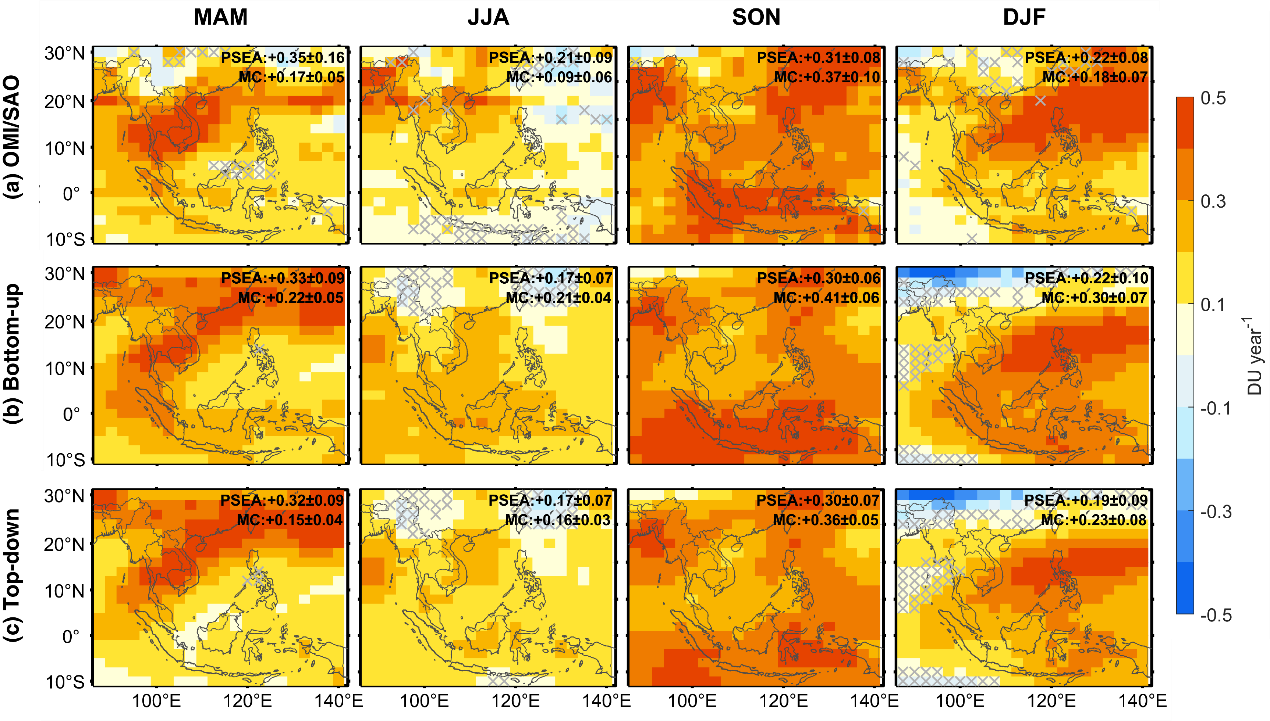
Figure 3. Trends of seasonal tropospheric column ozone concentrations from 2005 to 2016 (a) as observed by the OMI satellite instrument, (b) as simulated with bottom-up emissions, and (c) as simulated with top-down emissions.
This study further showed that the simulated surface and tropospheric ozone trends driven by current “bottom-up” emission inventories were smaller than the observed trends over PSEA, but much larger than the observed trends over the MC. The researchers pointed out that current emission inventories might have underestimated the growths of NOx emissions over the PSEA. Conversely, current inventories may have overestimated NOx emission growths over the MC because they did not account for vehicular emission regulations successively put in place by Southeast Asian countries after 1996.
Prof. Fu’s team and collaborators designed a “top-down” simulation, where the anthropogenic and biomass-burning emissions of NOx over Southeast Asia were scaled with satellite-observed NO2 trends, which significantly improved the agreement with observations in both regions. Using model sensitivity experiments, they quantified the drivers of the observed ozone changes over Southeast Asia. Over the PSEA, the simulated seasonal surface ozone trends were driven by anthropogenic emission growths in Southeast Asia (Figure 4). Furthermore, the modest surface ozone trends over the MC were profoundly affected by interannual variations of meteorology from 2005 to 2016. The rapid tropospheric ozone increases over Southeast Asia were driven mainly by the anthropogenic emission growths from the rest of the world.
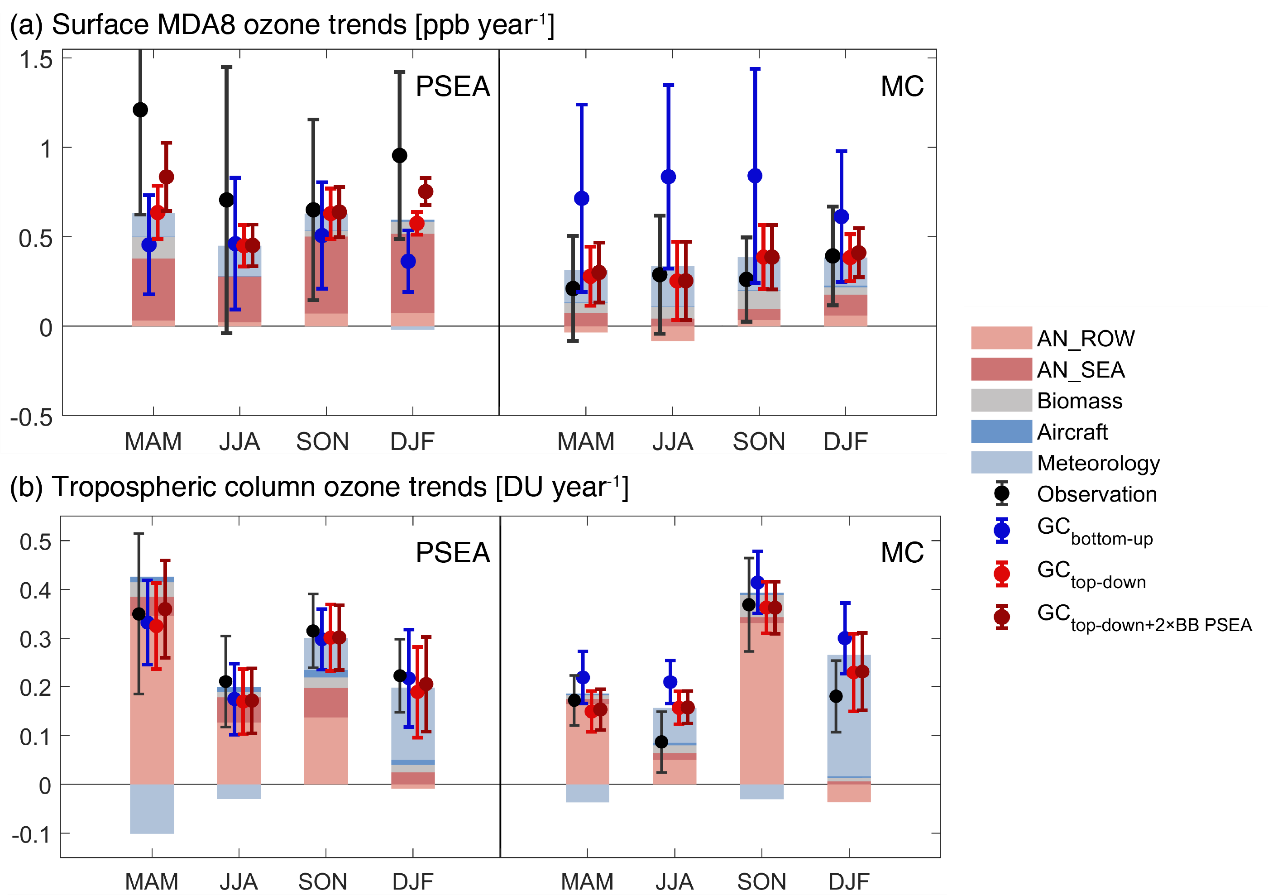
Figure 4. Driving factors contributing to (a) surface and (b) tropospheric ozone trends for the years between 2005 and 2016.
This study helped scientists to better understand tropospheric ozone changes in the tropics, as well as informing the policy-making of air quality management in Southeast Asia.
Xiaolin Wang, a Ph.D. student at PKU, is the first author of this study. Prof. Tzung-May Fu of SUSTech and Prof. Lin Zhang of PKU are the corresponding authors.
This work was supported by the National Natural Science Foundation of China (NSFC) and the Basic and Applied Basic Research Foundation of Guangdong Province. Computational resources were provided by the Center for Computational Science and Engineering at SUSTech.
Paper link: https://doi.org/10.1029/2022GL100223
To read all stories about SUSTech science, subscribe to the monthly SUSTech Newsletter.
Proofread ByAdrian Cremin, Yingying XIA
Photo By