Tropospheric ozone is a trace gas and major air pollutant with adverse impacts on human and ecosystem health. Ozone pollution in China leads to about 180,000 deaths every year, and recent observations show that ozone pollution is worsening. Because of the nonlinear chemistry of ozone formation, mitigation of ozone has been proven difficult.
Assistant Professor Huizhong Shen’s team from the School of Environmental Science and Engineering at the Southern University of Science and Technology (SUSTech) and Zhe Sun from the Centre for Atmospheric Science, Yusuf Hamied Department of Chemistry at the University of Cambridge have explored this issue.
In this study, they developed a new method to numerically investigate the nonlinear chemistry of ozone formation. Compared to past methods, their approach can capture more accurately the nonlinear responses of ozone to its precursors’ emissions (i.e., nitrogen oxides (NOx) and volatile organic compounds (VOCs)) and thus facilitates policy-making for ozone mitigation.
Their research, entitled “Novel Method for Ozone Isopleth Construction and Diagnosis for the Ozone Control Strategy of Chinese Cities,” was published in Environmental Science & Technology, an impactful environmental science and environmental technology research journal.

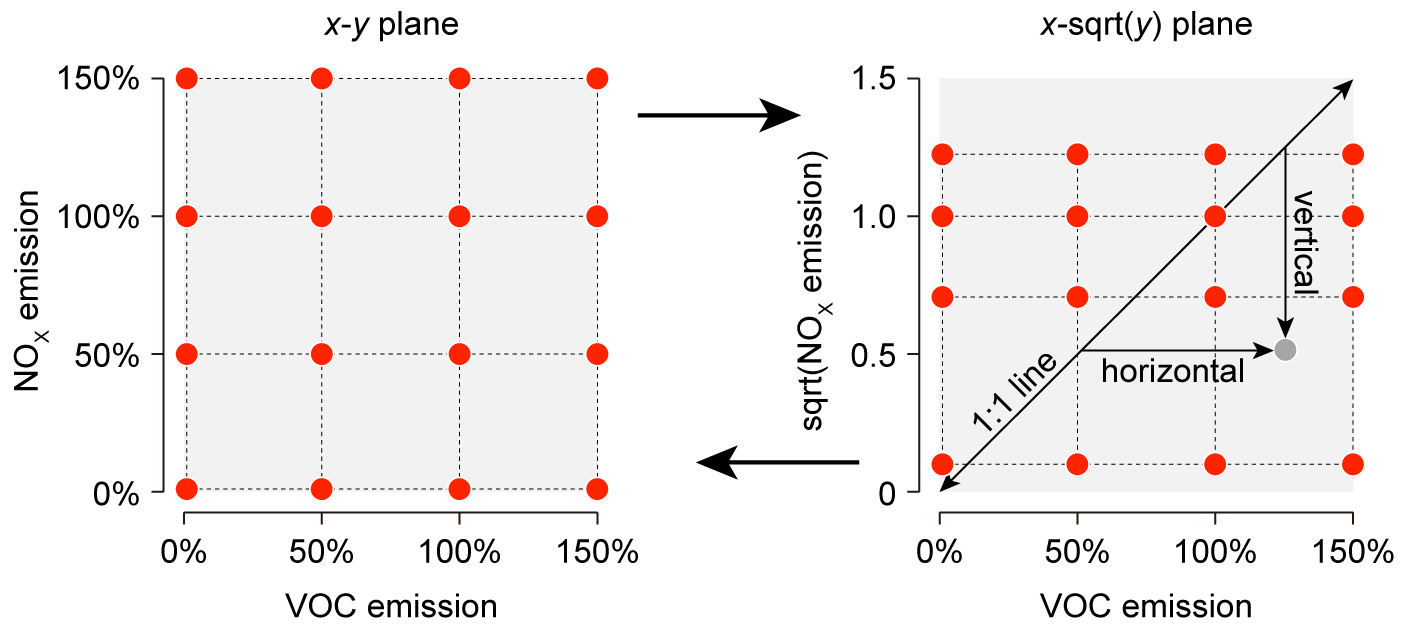
Ozone isopleths depict the ozone response to NOx and VOCs and have been widely used to diagnose ozone formation. Accurately constructing ozone isopleths is challenging and usually requires hundreds of model simulations or a large number of measurements. In this study, the researchers used a high-order integral method (HIM) to generate ozone isopleths numerically based on an advanced sensitivity analysis technique, i.e., the high-order decoupled direct method (HDDM). HIM integrates a small number of HDDM simulations and can generate ozone isopleths more accurately and efficiently than conventional approaches (e.g., the brute force).

Figure 1. Schematic of the coordinate system transformation and the high-order integral method (HIM) to generate ozone isopleths. “sqrt” denotes square-root transformation.
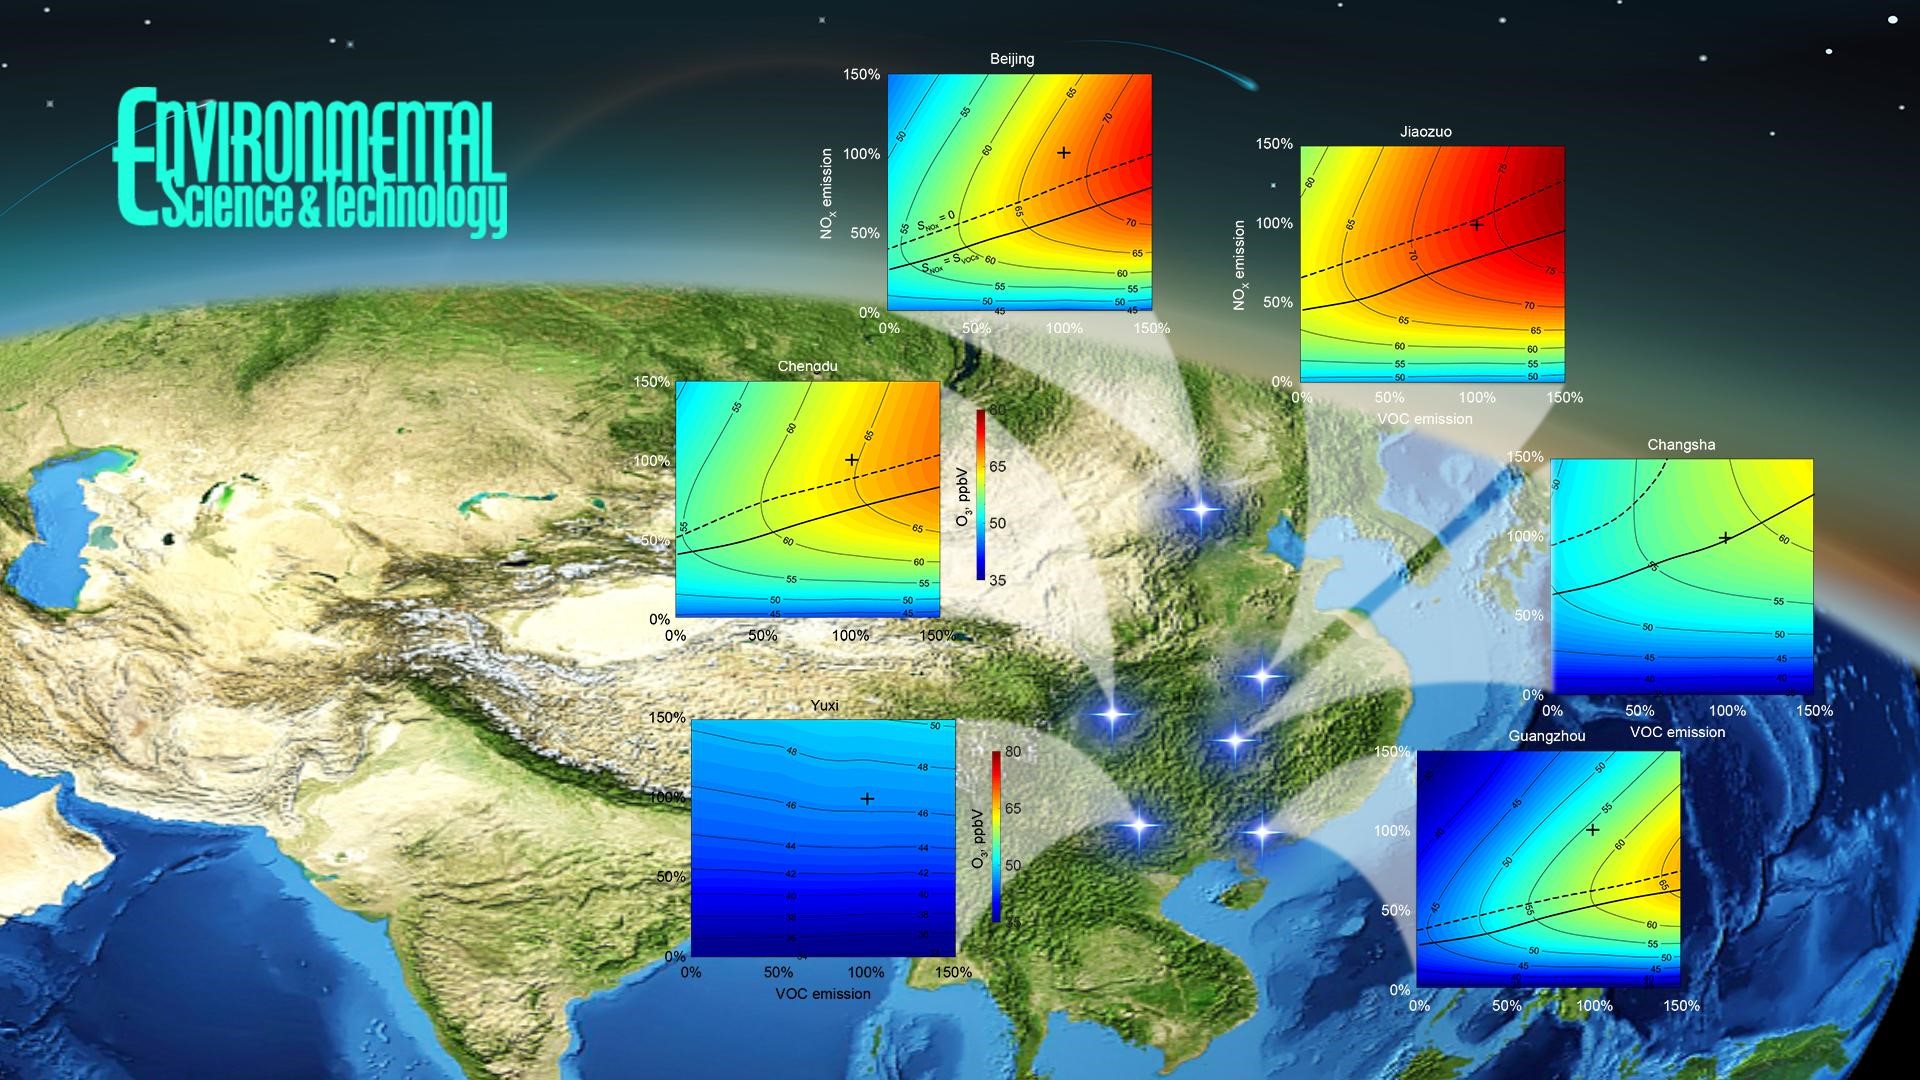
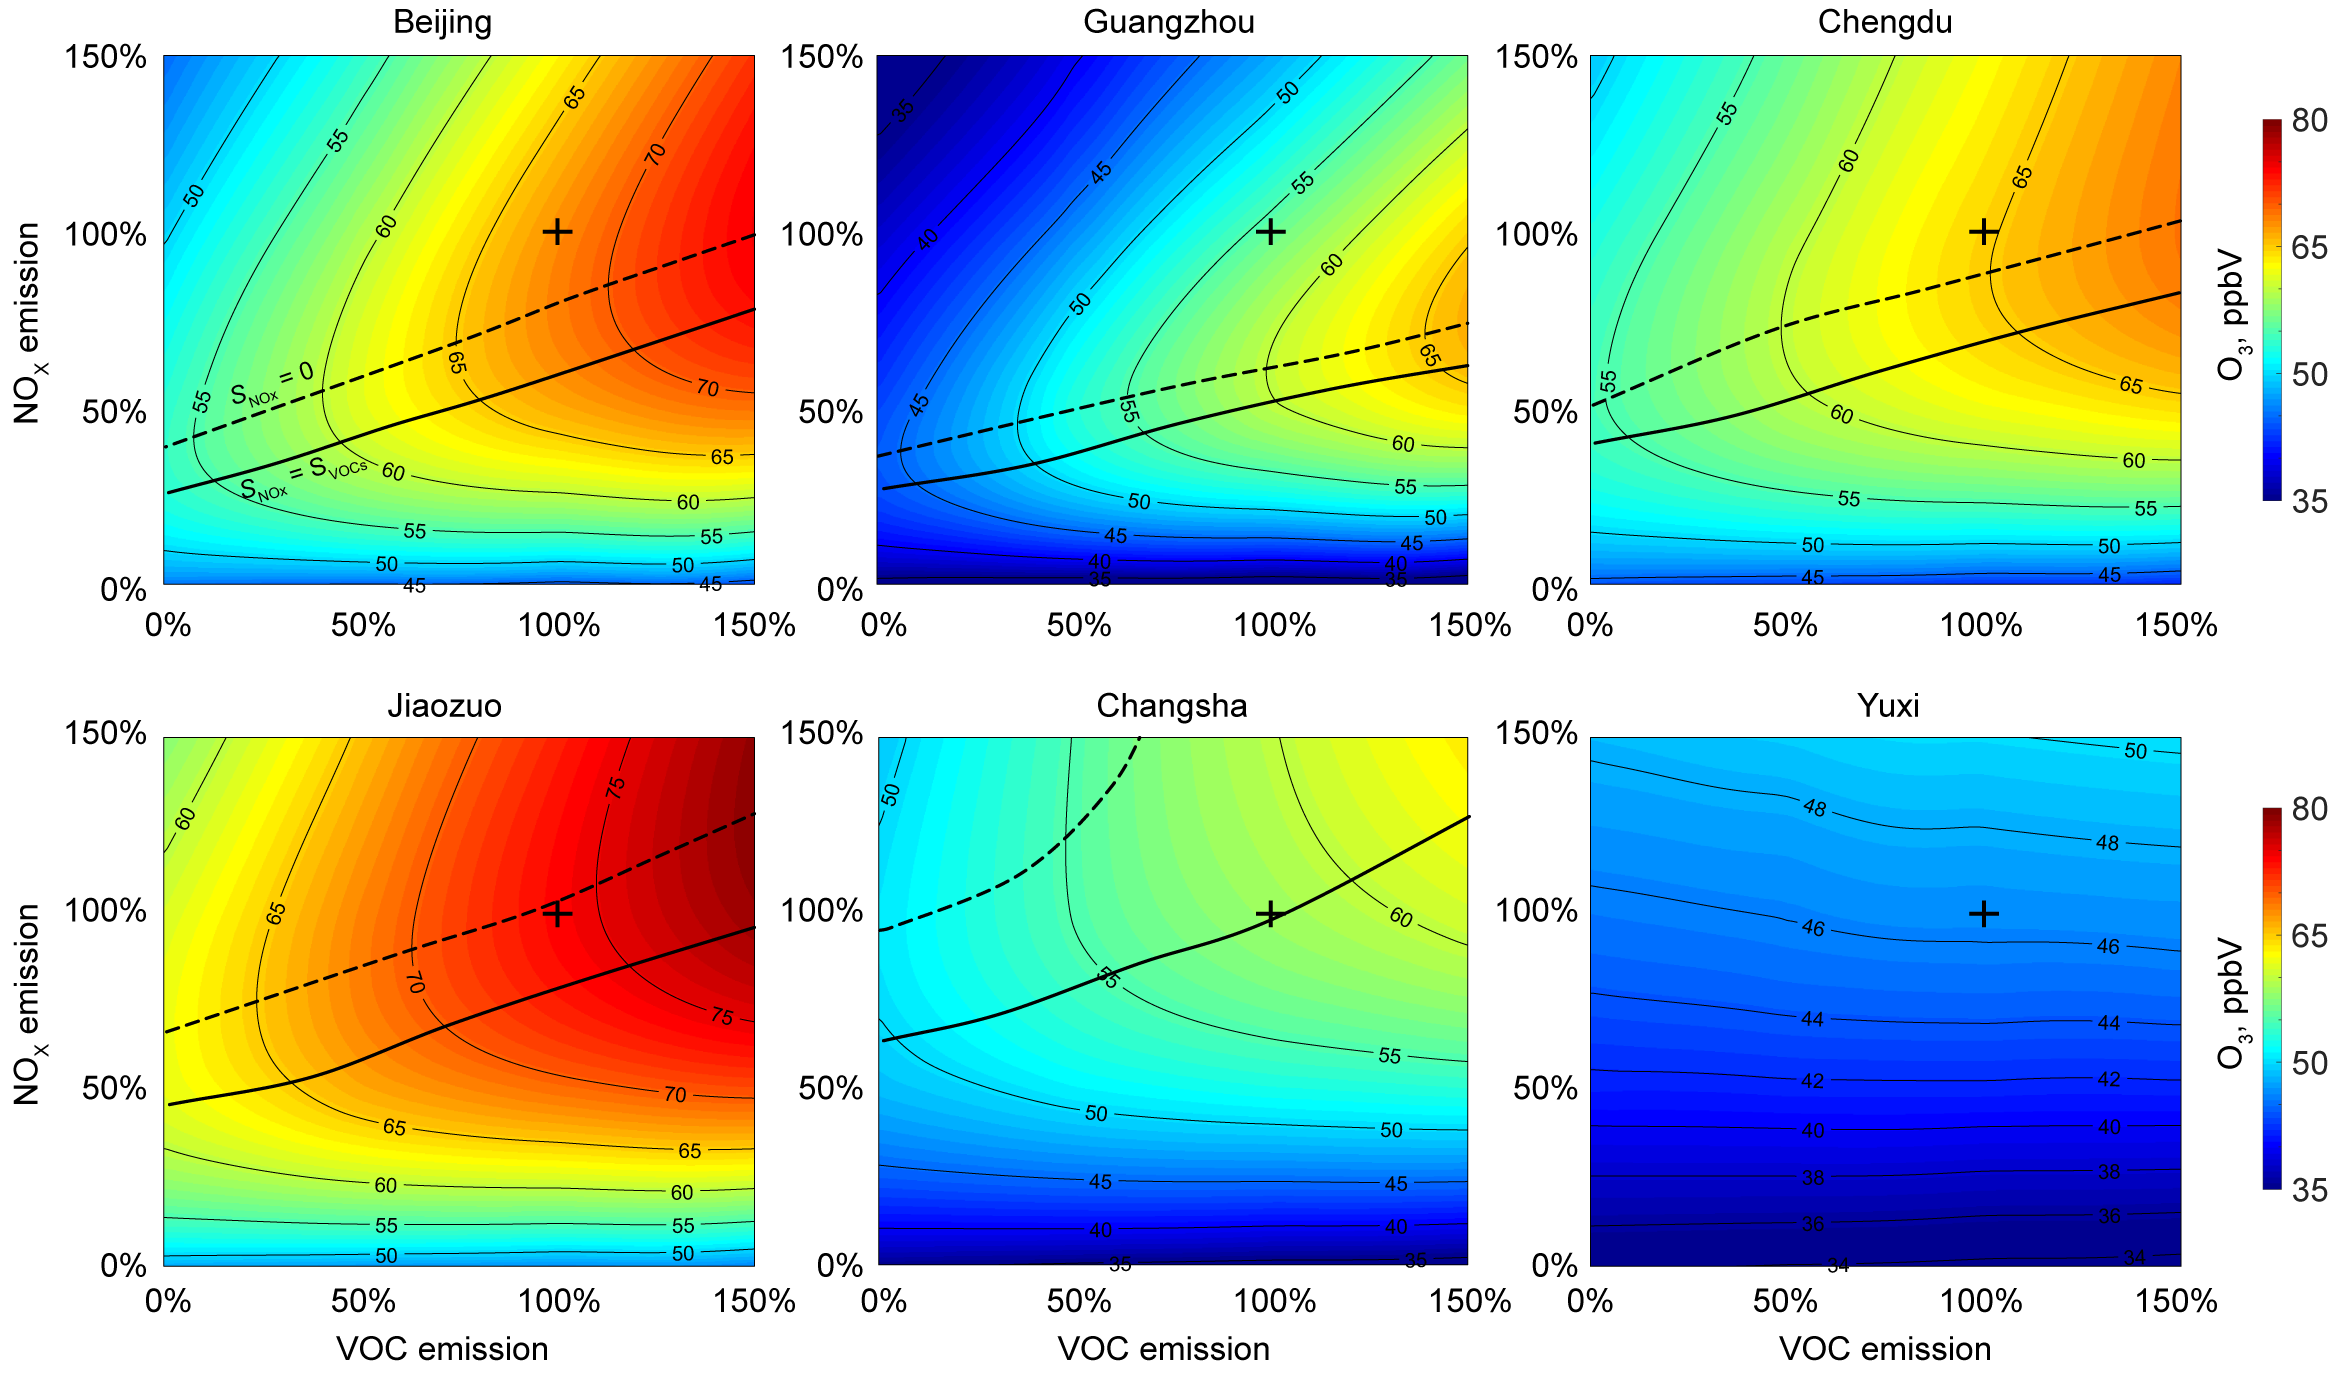
Based on this method, they investigated the ozone pollution in China. They discovered that, in 2017, 97% of the residents in China experienced at least one day in excess of Chinese Level-II Ambient Air Quality Standards for ozone. Different cities respond differently to NOX and VOC emission changes, as reflected by the different patterns of their ozone isopleths (Figure 2). For example, in Beijing and Guangzhou, reducing VOCs effectively reduces ozone mitigation, while reducing NOx increases ozone. Moderately or less developed cities are more divided in their ozone isopleths patterns. Still, their ozone isopleths indicate that in most such cities, reducing NOx could be equally or more effective compared to reducing VOCs. Yuxi in Yunnan province (Figure 2), as a representative of a less-developed city, falls deep into the NOx-limited regime, meaning that reducing NOx is much more effective than reducing VOCs to ozone mitigation.

Figure 2. Ozone isopleths for six representative cities. The black cross marks the ozone concentration under 100% of NOx and VOC emissions, i.e., the current positions (2017) on the isopleths. The black dashed line is where the sensitivity to NOx emission changes is zero (above which, increased NOx emissions decrease ozone). The solid black line is where the VOC and NOx emission sensitivities are the same.
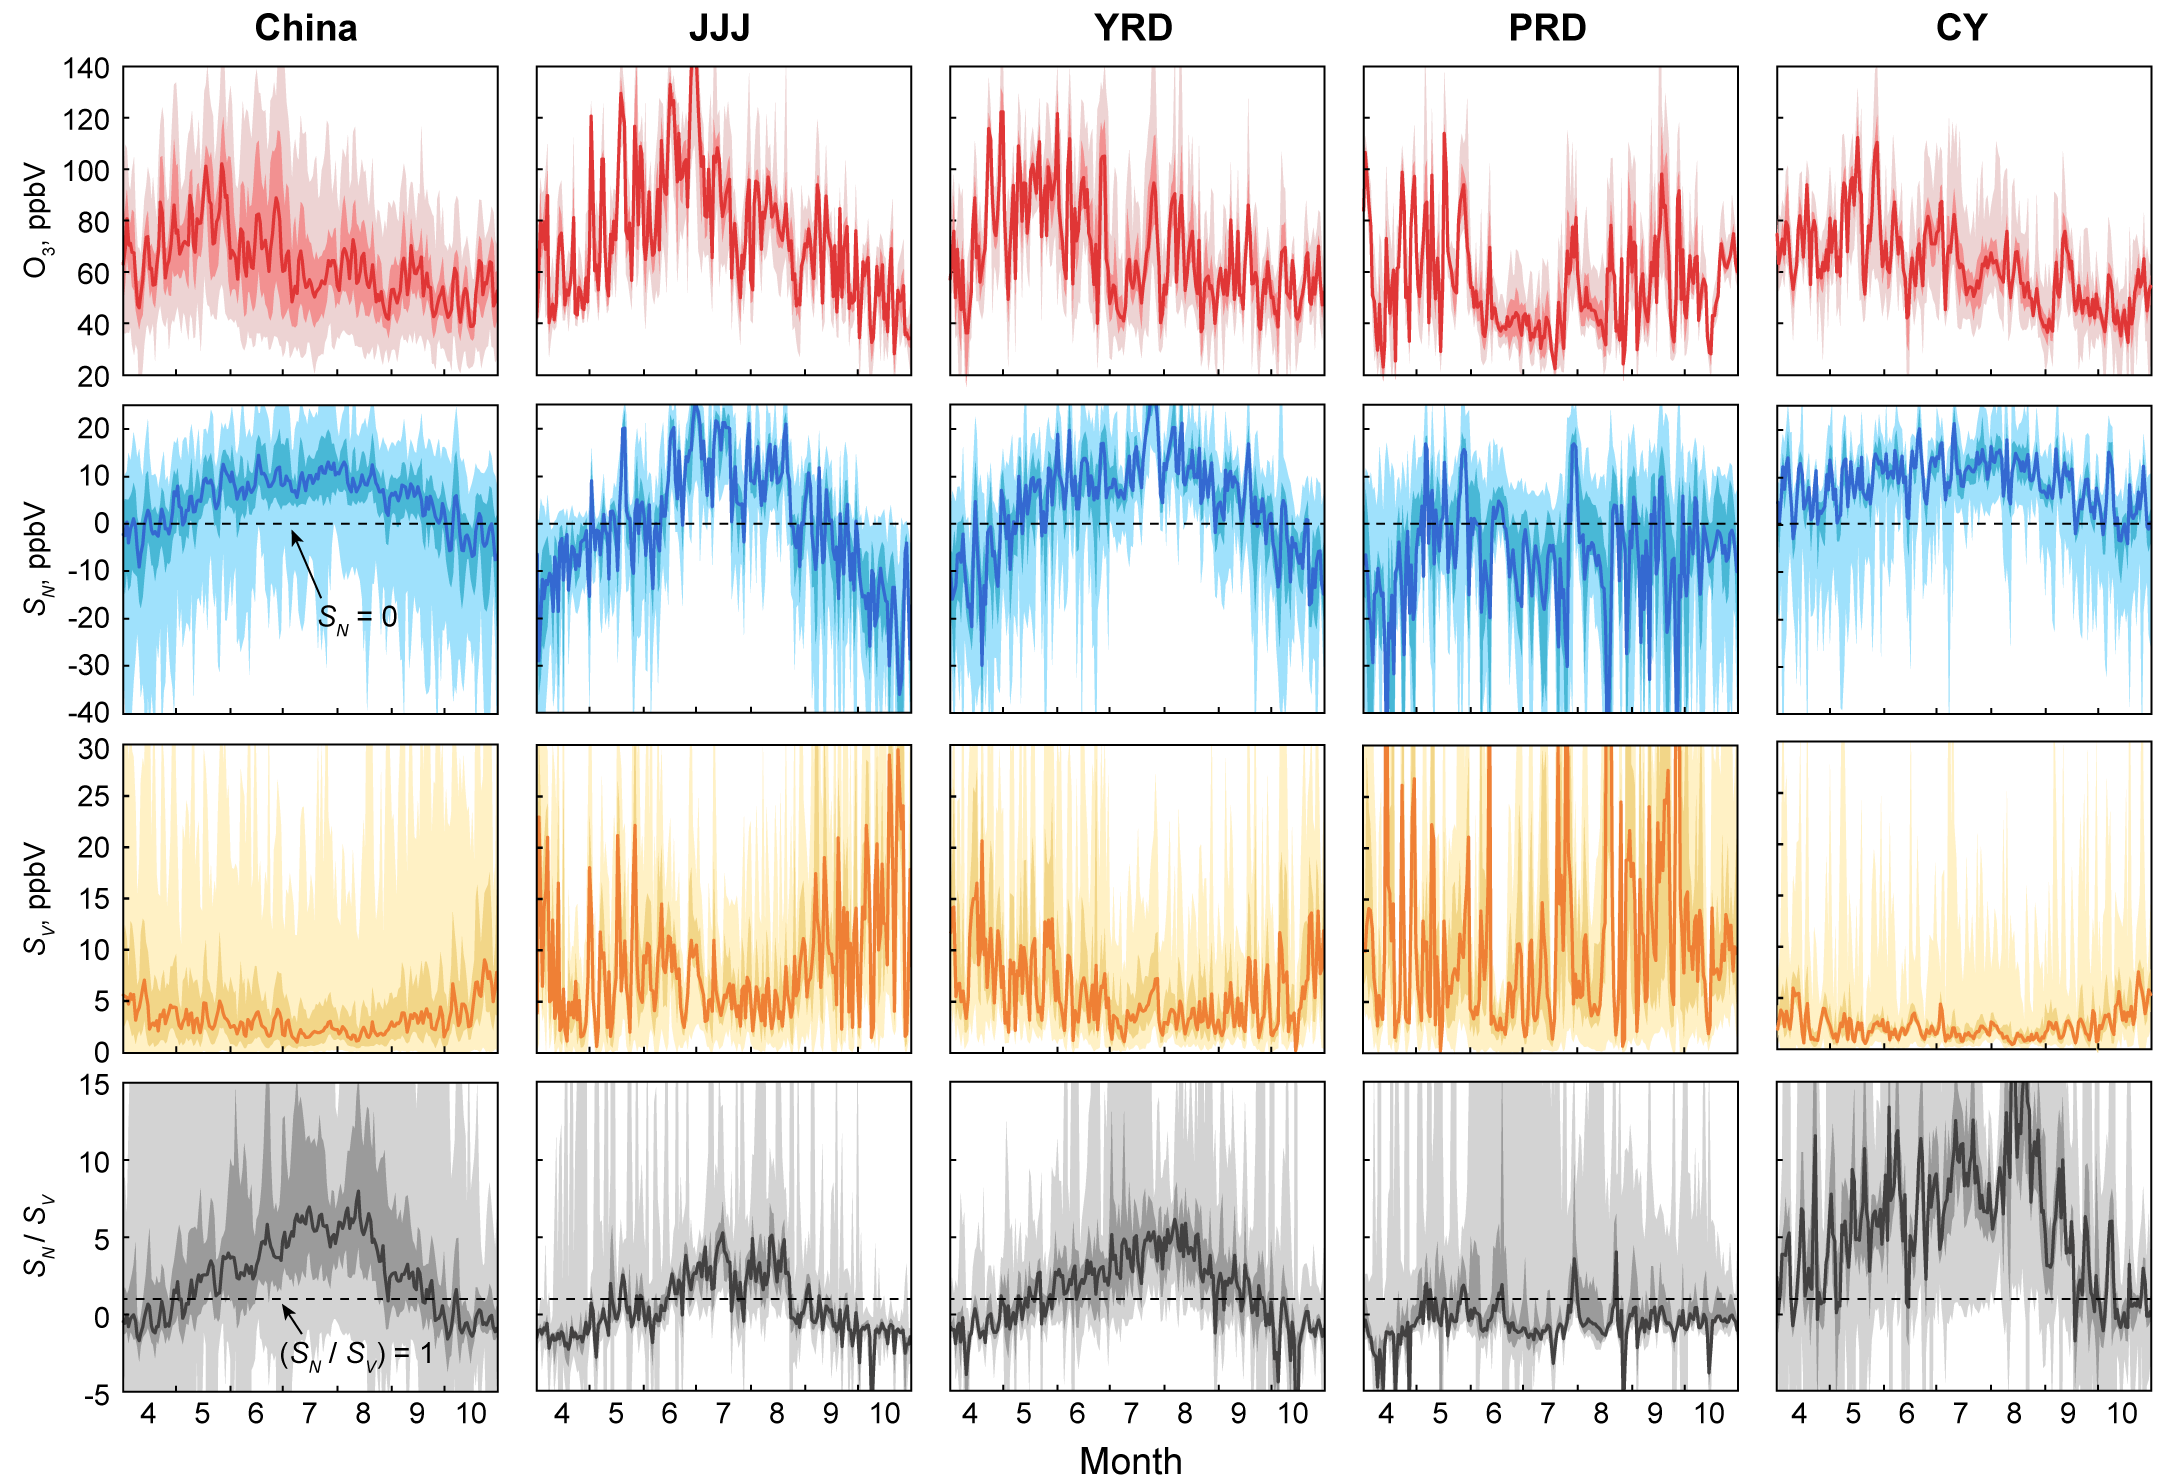
Prof. Shen’s team further investigated the temporal trends in ozone concentration, the sensitivity of ozone to NOx emission (SN), and the sensitivity of ozone to VOC emission (SV) in China with a focus on four representative regions: the Jing-Jin-Ji metropolitan area (JJJ, located in the north of NCP), Yangtze River Delta (YRD), Pearl River Delta (PRD), and the Cheng-Yu metropolitan area (CY). Temporally, ozone concentration across China peaks in May (Figure 3). Similar peaks in May were also evident in YRD, PRD, and CY. Both modeled and observed ozone concentrations exhibit multiple peaks over PRD. SN summit in June-July-August across all China regions except PRD, which displays multiple peaks. SV, on the other hand, shows a trough in most regions in the summer. This is attributed to the strong solar radiations in summer that endow the photolysis of NOx with a predominant position over the contribution from VOCs. Therefore, the ozone sensitivities from VOCs were suppressed.
The ratio of SN to SV generally peaks in summer, suggesting that a NOx-limited regime is of higher frequency to occur in summer. An exception is PRD, where SN/SV ratios are mostly negative throughout the study period. Considerable variability of the ratios is evident within each region, as illustrated by the shaded areas in Figure 3.

Figure 3. Daily variations in maximum daily average 8 hour (MDA8h) ozone concentrations, SN, SV, and SN/SV in China and four target regions during the ozone season in 2017. Variables are shown as population-weighted levels in the regions. The solid line indicates the median level; the shaded area with the dark color presents the inter-quartile range covering 50% population; the shaded area with the light color denotes the 95% interval.
The ozone responses to emissions of precursors vary widely across individual cities. In densely populated metropolitan areas such as JJJ, YRD, and PRD, NOx reduction increases ozone in the short term. Ambient ozone pollution in the eastern region generally is limited by VOCs, while in the west by NOx. The city-specific ozone isopleths generated by HIM are instrumental in forming hybrid and differentiated strategies for ozone abatement in China.
Assistant Professor Huizhong Shen from SUSTech and Zhe Sun from the University of Cambridge are the co-first authors of this paper. Huizhong Shen is also the corresponding author.
This work is supported by the National Natural Science Foundation of China (NSFC), the Shenzhen Environmental Monitoring Center, the U.S. Environmental Protection Agency, the U.S. National Science Foundation, and the Center for Computational Science and Engineering at SUSTech.
Paper link: https://doi.org/10.1021/acs.est.1c01567
To read all stories about SUSTech science, subscribe to the monthly SUSTech Newsletter.
Proofread ByAdrian Cremin, Yingying XIA
Photo By