Climate change and anthropogenic activities have been changing hydrological cycles. Inland water bodies, such as rivers, lakes, and reservoirs are significantly disturbed. Unfortunately, current in-situ monitoring of such variations is lacking. We do not fully understand where, when, and how these bodies of water change. This has spurred scientists to develop new approaches. One of many alternatives is monitoring from space, and the Surface Water and Ocean Topography (SWOT) mission is a game-changer. However, the potentials of SWOT in helping understand surface water dynamics are yet to be fully realized.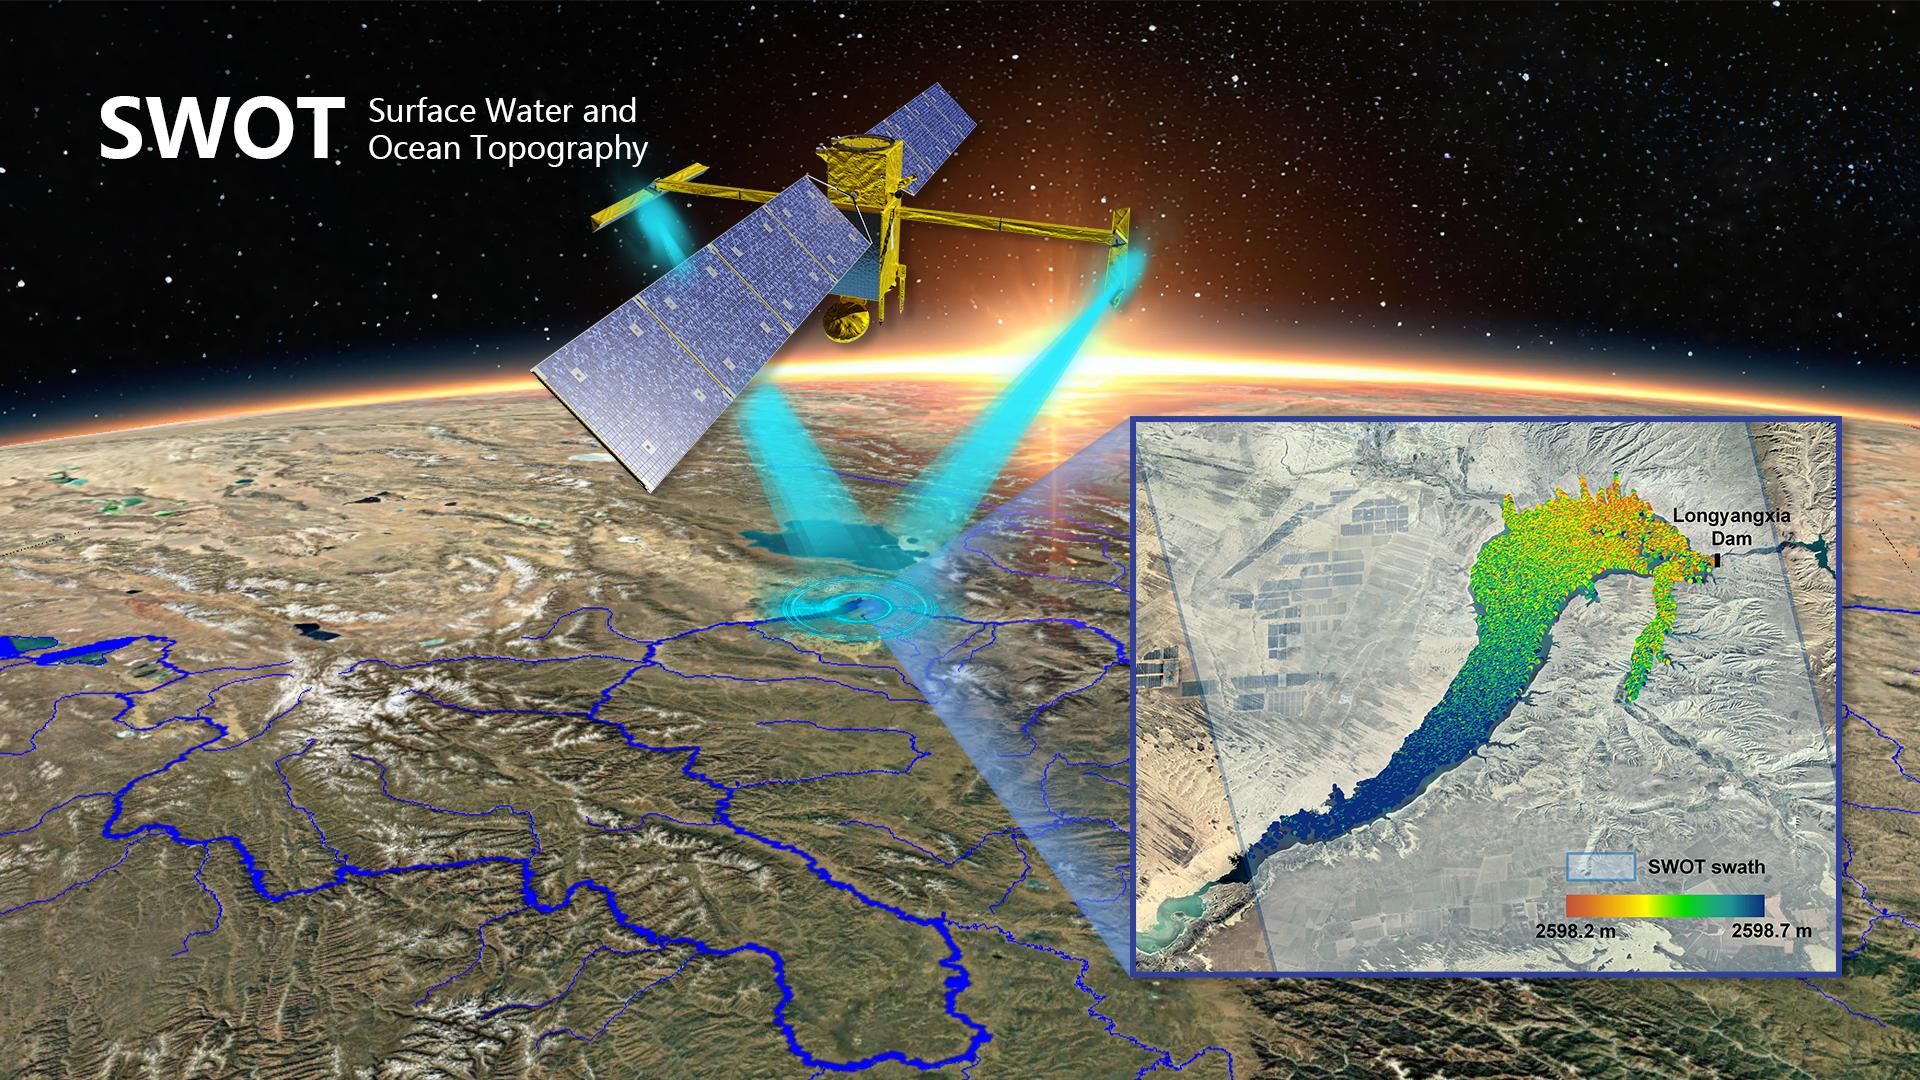
Assistant Professor Liguang JIANG’s research group from the School of Environmental Science and Engineering at the Southern University of Science and Technology (SUSTech) has made a series of breakthroughs in SWOT applications for the analysis of hydrodynamics of rivers and reservoirs. Two recent papers published in Geophysical Research Letters showcase the great capabilities of SWOT in capturing flood evolution, backwater phenomena, and reservoir hydrodynamics. The findings offer new insights into inland water monitoring using the novel observations from SWOT.
Paper 1: SWOT captured the flood routing process and backwater effects in the Upper Missouri river basin
River flood processes exhibit strong spatiotemporal characteristics. Traditional monitoring methods based on hydrological gauges fail to capture the dynamic propagation of flood waves between adjacent stations. Designed for two-dimensional observation of Water Surface Elevation (WSE) and Water Surface Slope (WSS), the SWOT satellite enables the instantaneous monitoring of WSE and WSS at the reach scale. This two-dimensional WSE data offers unprecedented opportunities for investigating a multitude of hydrological phenomena and processes. To explore the potential of SWOT in monitoring river dynamic processes, this study presents a pioneering empirical investigation within the Missouri River Basin.
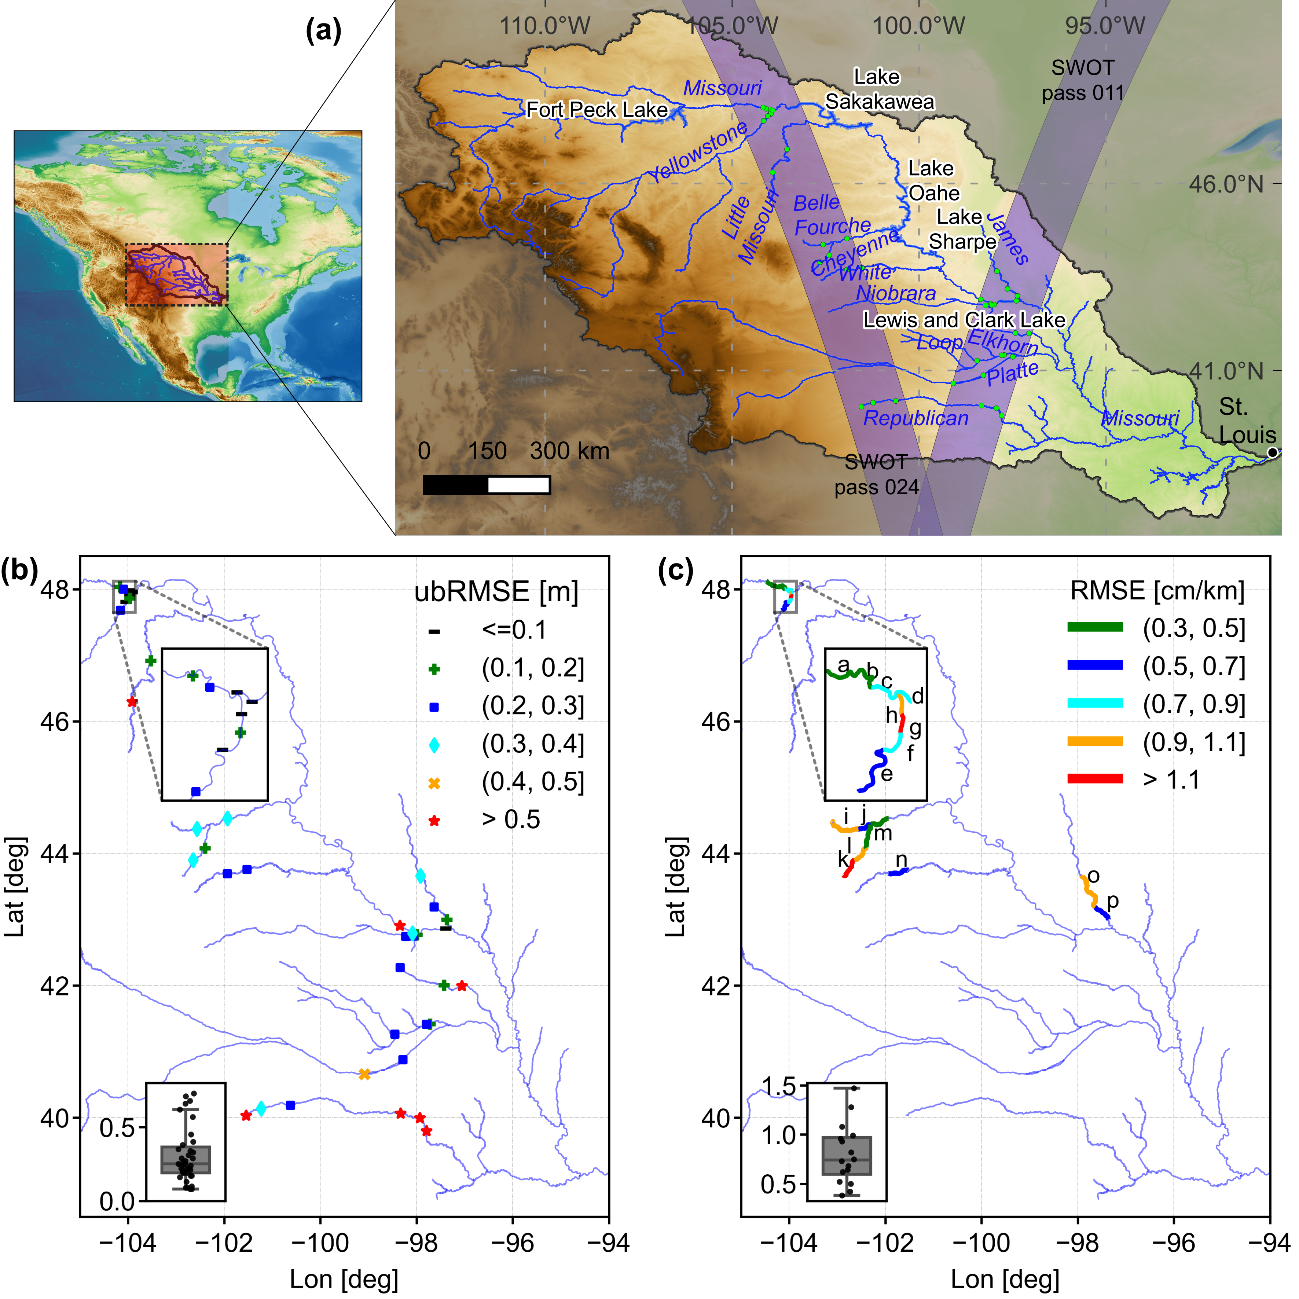
Figure 1. Geographic map of the Missouri River Basin and assessments of WSE and WSS. (a) The Missouri River network and major lakes along the main Missouri are shown. USGS stream gauges within SWOT coverage are indicated with green dots; the major lakes (reservoirs) are also labeled. Please refer to Table S1 in Supporting Information S1 for detailed information about gauges. (b) Assessment accuracy of SWOTWSE against USGS in situ data in terms of unbiased root‐mean‐squared error (ubRMSE) at 39 stations. Left‐corner box plot shows the dispersion of ubRMSE. (c) Assessment accuracy of SWOT WSS against USGS in situ data in terms of RMSE at 16 reaches.
Leveraging daily observation data from the SWOT Calibration and Validation (Cal/Val) phase, this study first quantified the measurement accuracy of WSE and WSS across rivers of varying scales within the Missouri River Basin. The overall WSE error was determined to be 0.25 m, while the WSS error was 0.74 cm/km. Daily river longitudinal profiles clearly depicted the downstream propagation of flood waves, demonstrating SWOT’s capability to characterize the spatiotemporal dynamics of flood waves. Analysis of the WSS variations observed at the Missouri-Yellowstone confluence revealed that flood events in the Yellowstone tributary induced backwater effects in the Missouri mainstem, exacerbating the risk of floodplain inundation.
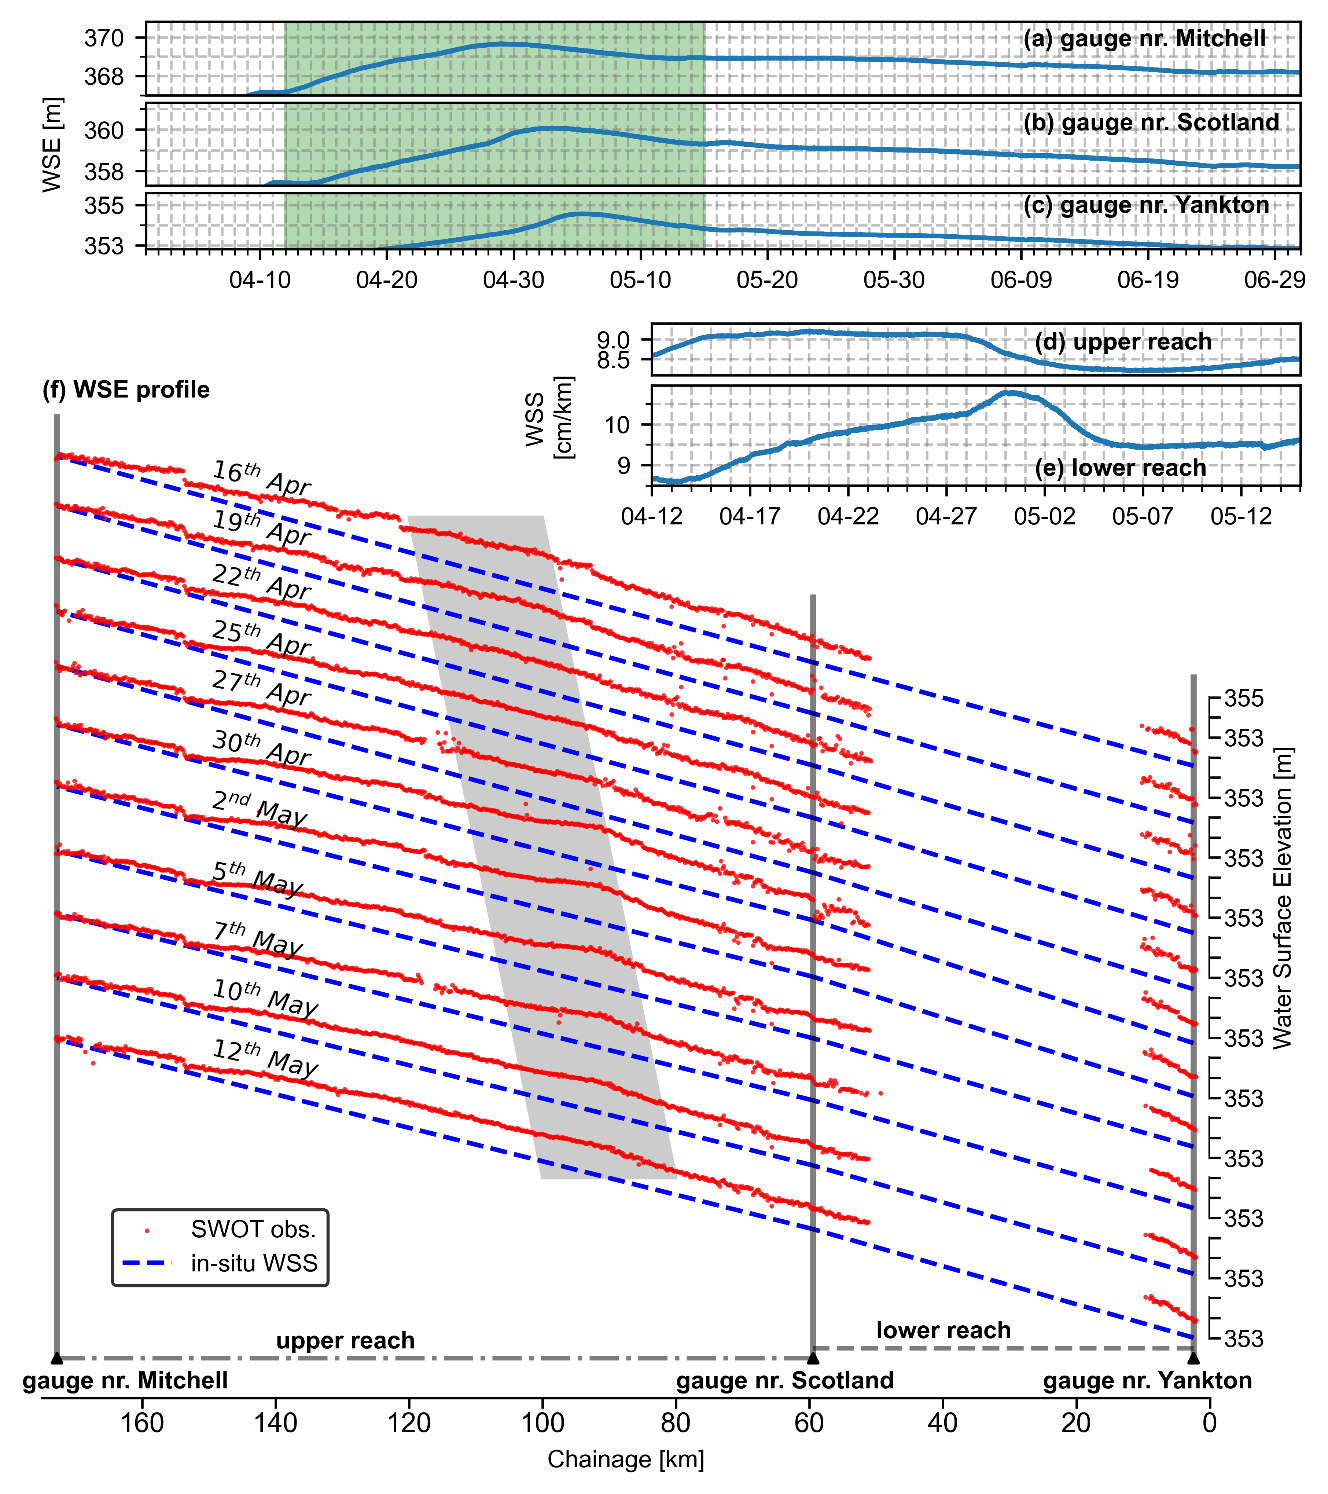
Figure 2. WSS of the James River tributary (reaches o and p as shown in Figure 1c) of the Missouri River. (a–c) Show the in situ water levels; (d–e) are the corresponding twin‐gauge slopes; (f) shows the instantaneous longitudinal profiles during the flood event. The gray area in (f) highlights the propagation of the flood peak captured by SWOT. Note that there are no data over the lower reach due to the SWOT nadir gap. The site IDs of the three gauges near Mitchell, Scotland, and Yankton are 06478000, 06478500, and 06478513, respectively.
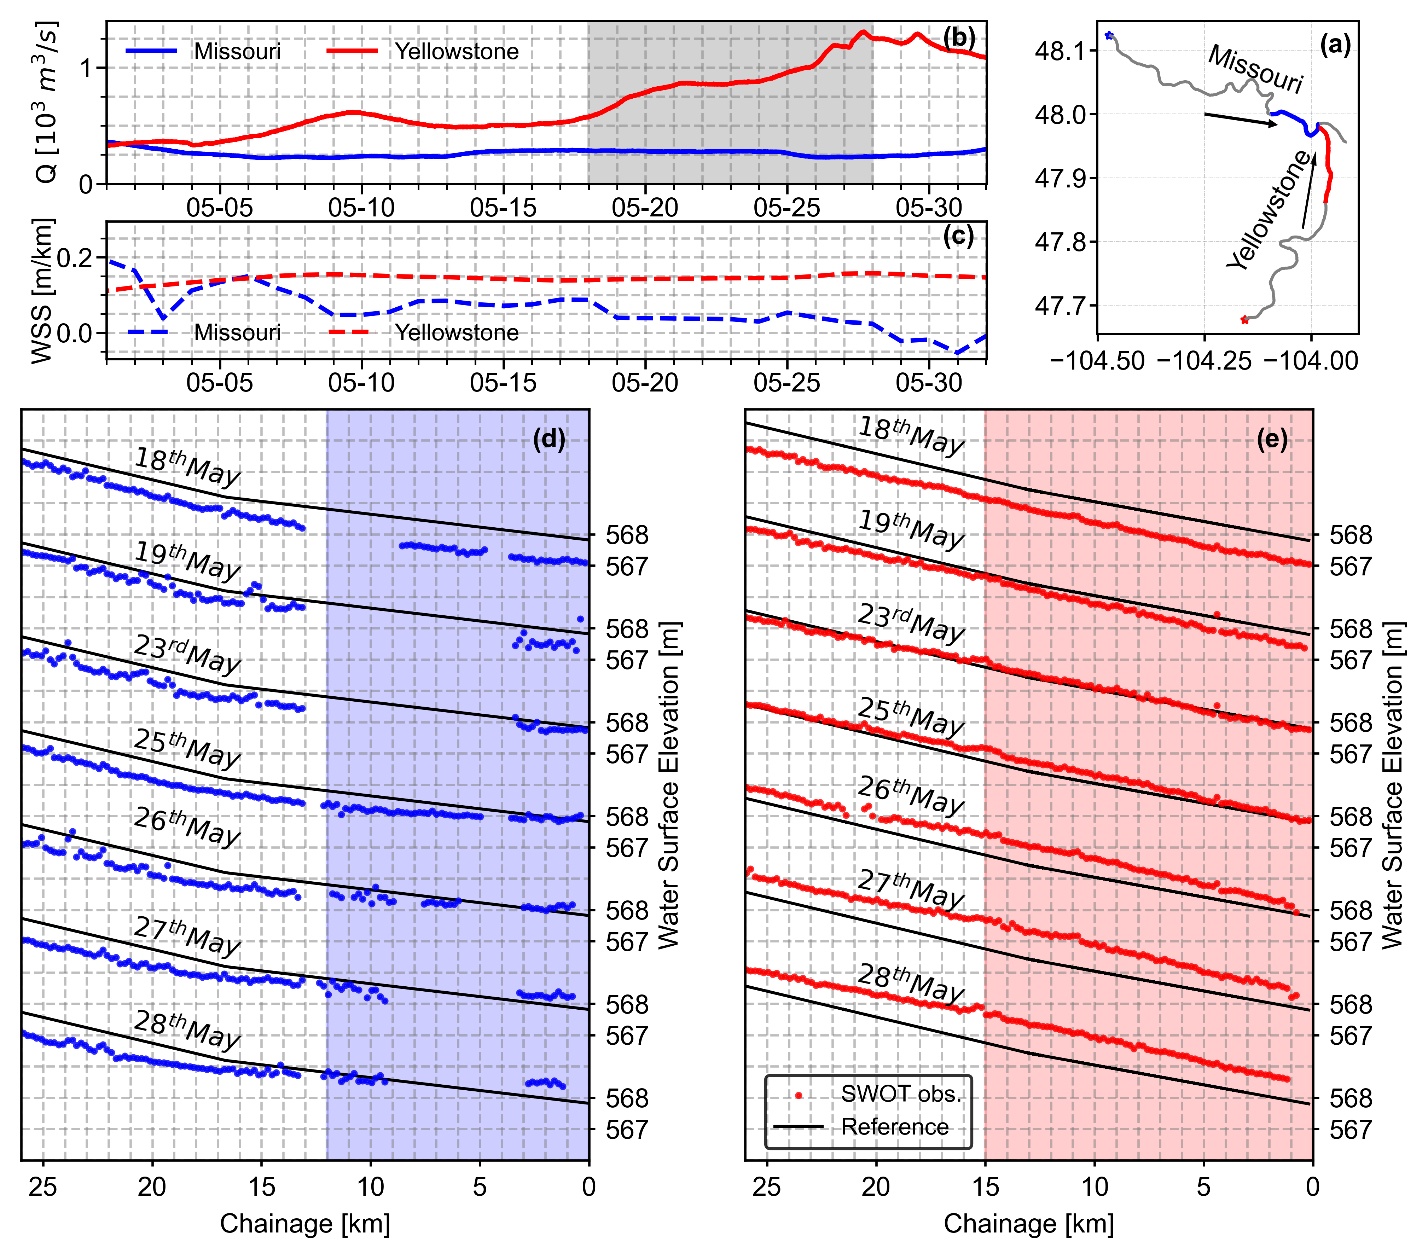
Figure 3. Backwater effects at the confluence of the Missouri and Yellowstone rivers. (a) Map of the river network, the two reaches used to investigate the backwater effects, and locations of gauges from which the discharge time series are shown in (b); (c) SWOT derived 3‐day moving average WSS of two reaches as highlighted in blue and red in (a), (d) and (e); (d) and (e) show the river long profiles on selected dates during the flood event of the Missouri and Yellowstone in May.
The above findings have been recently published in Geophysical Research Letters, titled “SWOT Reveals Detailed Dynamics of Longitudinal River Slope in the Missouri River Basin”. SUSTech is the first affiliation of this paper. Assistant Professor Liguang JIANG from the School of Environmental Science and Engineering serves as the first and corresponding author. Collaborating institutions include the Technical University of Denmark (DTU) and North China University of Water Resources and Electric Power (NCWU).
Paper 2: SWOT unveils a detailed hydrodynamic characteristics of the Three Gorges Reservoir
Dam construction is popularly understood to significantly alter the natural hydrodynamic conditions. Current understanding of how the operation of large reservoirs affect upstream and downstream hydrodynamic processes primarily relies on hydrodynamic model simulations. However, such modeling often involves significant uncertainty and lacks support from observational evidence. Previous studies rarely characterize the intrinsic hydrodynamics of the reservoir itself, leaving numerous questions yet to be investigated. For example, can the spatial heterogeneity of the reservoir’s Water Surface Elevation (WSE) be ignored? What are the formational mechanisms? And how do reservoir inflows and outflows influence the reservoir’s water level and slope?
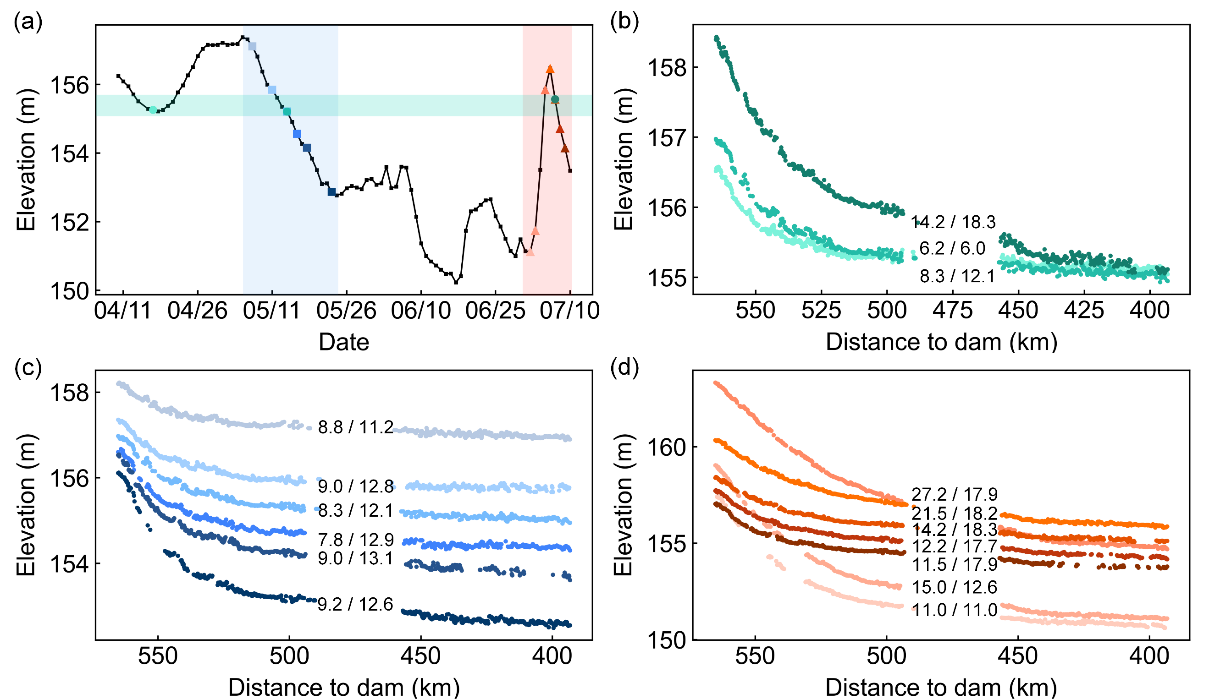
Figure 4. WSE profiles observed by SWOT and corresponding inflow and release (103 m3/s). (a) WSE time series at gauge 7. Shadings indicate three conditions of interest. (b) WSE profiles of three dates when similar WSEs occur at gauge 7. (c) Same as (b), but for a period of rapid water level decline. (d) Same as (b), but for a period of substantial WSE fluctuations. The numbers labeled indicate the inflow and release.
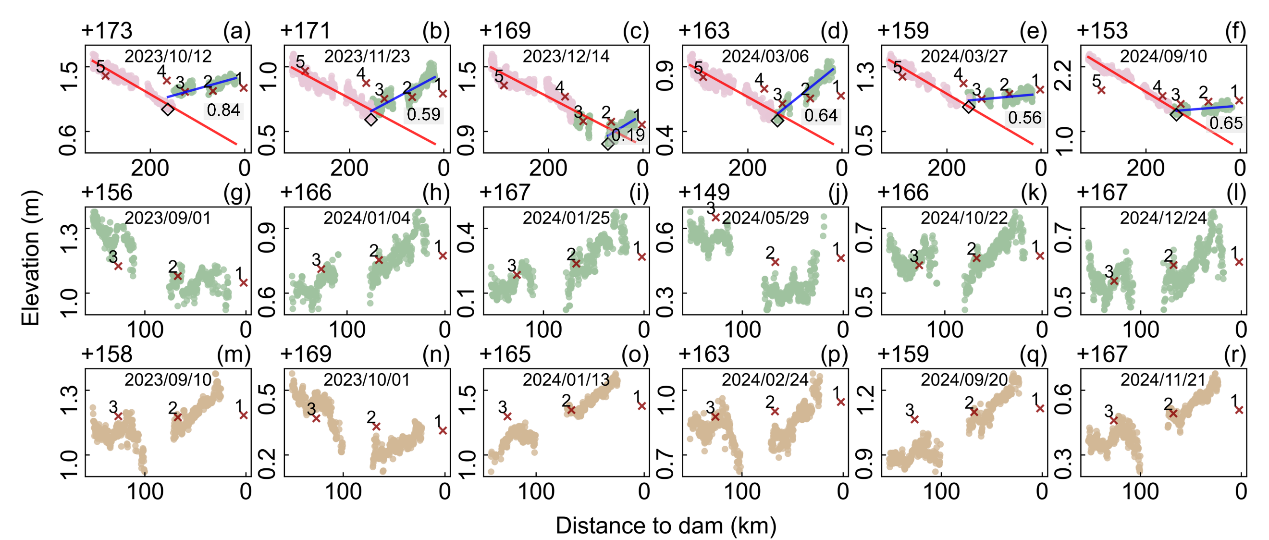
Figure 5. WSS and backwater effects. (a–r) WSE profiles are derived from the Raster product of SWOT 21‐day repeat cycles. Scatter point colors indicate different SWOT passes: pink for Pass 577, green for Pass 6, and yellow for Pass 271; Pass 577 and Pass 6 are approximately 10 hours apart. Red crosses show concurrent gauge observations. Diamonds mark the location of the lowest observed WSE in each profile. Red and blue lines represent separate linear regressions for the upstream and downstream segments, with the upstream regression line extended downstream. Assuming the upstream slope is consistent, the elevation difference between the two fitted lines at the location nearest the dam is annotated to highlight backwater‐induced changes.
This research fully capitalized on the WSE data provided by the SWOT satellite—which acquires high-precision WSE observations—to construct instantaneous snapshots of the reservoir surface topography. We demonstrate that data from SWOT’s 1-day repeat cycle can more accurately resolve the spatiotemporal dynamic characteristics of the reservoir surface topography.
Findings indicate that relying solely on the observed water level at the reservoir head fails to accurately reflect the reservoir’s overall WSE profile. The observed spatial heterogeneity of reservoir WSE challenges the veracity in traditional reliance on a single gauge to represent the entire reservoir water level, providing crucial insight into the hydrodynamic characteristics of the Three Gorges Reservoir.
Our results demonstrate that using WSE and slope data derived from SWOT yields a more accurate estimate of reservoir discharge compared to methods relying purely on inflow, offering an innovative methodology for discharge estimation. This technical approach has great potential for application in the global characterization of reservoir hydrodynamics and discharge estimation.
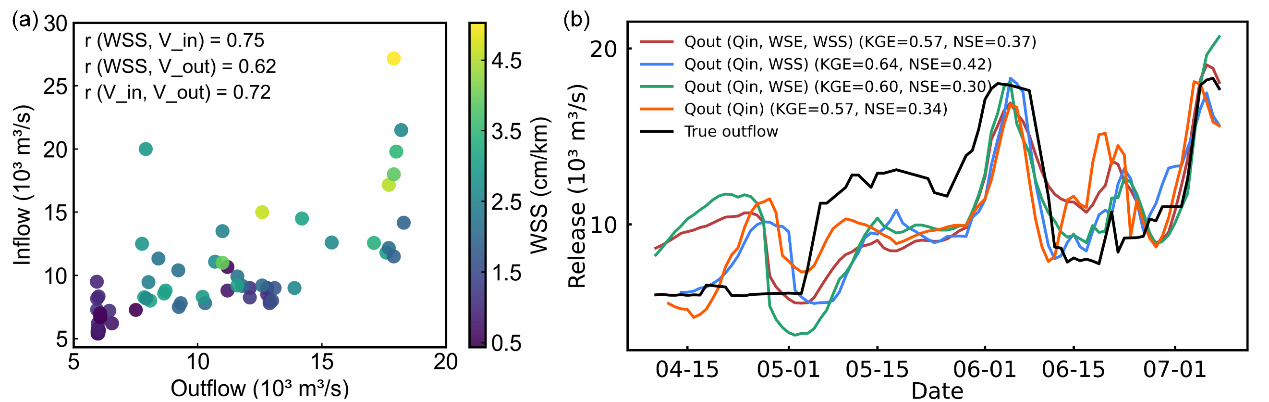
Figure 6. Relationships among WSS, inflow, and release. (a) Correlation between WSS, inflow, and outflow. The Pearson correlation coefficients are labeled in the upper‐left corner. (b) Release estimates based on Long Short‐Term Memory. Model performance of each scenario is indicated by Kling–Gupta Efficiency and Nash–Sutcliffe Efficiency.
The research findings, titled “SWOT Unveils the Hidden Hydrodynamics of the Three Gorges Reservoir,” were published in the journal Geophysical Research Letters. SUSTech is the first affiliation of the paper. Jie MING, a master’s student from the School of Environmental Science and Engineering, is the first author, and Assistant Professor Liguang JIANG is the corresponding author. The collaborating institution is North China University of Water Resources and Electric Power (NCWU).
Links to the papers:
https://agupubs.onlinelibrary.wiley.com/doi/10.1029/2025GL115953
https://agupubs.onlinelibrary.wiley.com/doi/10.1029/2025GL118488
Proofread ByNoah Crockett, Yifei REN
Photo BySchool of Environmental Science and Engineering


